| Filed by the Registrant | þ | ||
| Filed by a Party other than the Registrant | |||
| Check the appropriate box: | ||
| o | Preliminary Proxy Statement | |
| o | Confidential, For Use of the Commission Only (as permitted by Rule 14a-6(e)(2)) | |
| þ | Definitive Proxy Statement | |
| o | Definitive Additional Materials | |
| o | Soliciting Material Under Rule 14a-12 | |
| Payment of Filing Fee (Check the appropriate box): | |||
| þ | No fee required. | ||
| o | Fee computed on table below per Exchange Act Rules 14a-6(i)(1) and 0-11. | ||
| (1) | Title of each class of securities to which transaction applies: | ||
| (2) | Aggregate number of securities to which transaction applies: | ||
| (3) | Per unit price or other underlying value of transaction computed pursuant to Exchange Act Rule 0-11 (set forth the amount on which the filing fee is calculated and state how it was determined): | ||
| (4) | Proposed maximum aggregate value of transaction: | ||
| (5) | Total fee paid: | ||
| o | Fee paid previously with preliminary materials: | ||
| Check box if any part of the fee is offset as provided by Exchange Act Rule 0-11(a)(2) and identify the filing for which the offsetting fee was paid previously. Identify the previous filing by registration statement number, or the form or schedule and the date of its filing. | |||
| (1) | Amount Previously Paid: | ||
| (2) | Form, Schedule or Registration Statement No.: | ||
| (3) | Filing Party: | ||
| (4) | Date Filed: | ||
| TABLE OF CONTENTS |
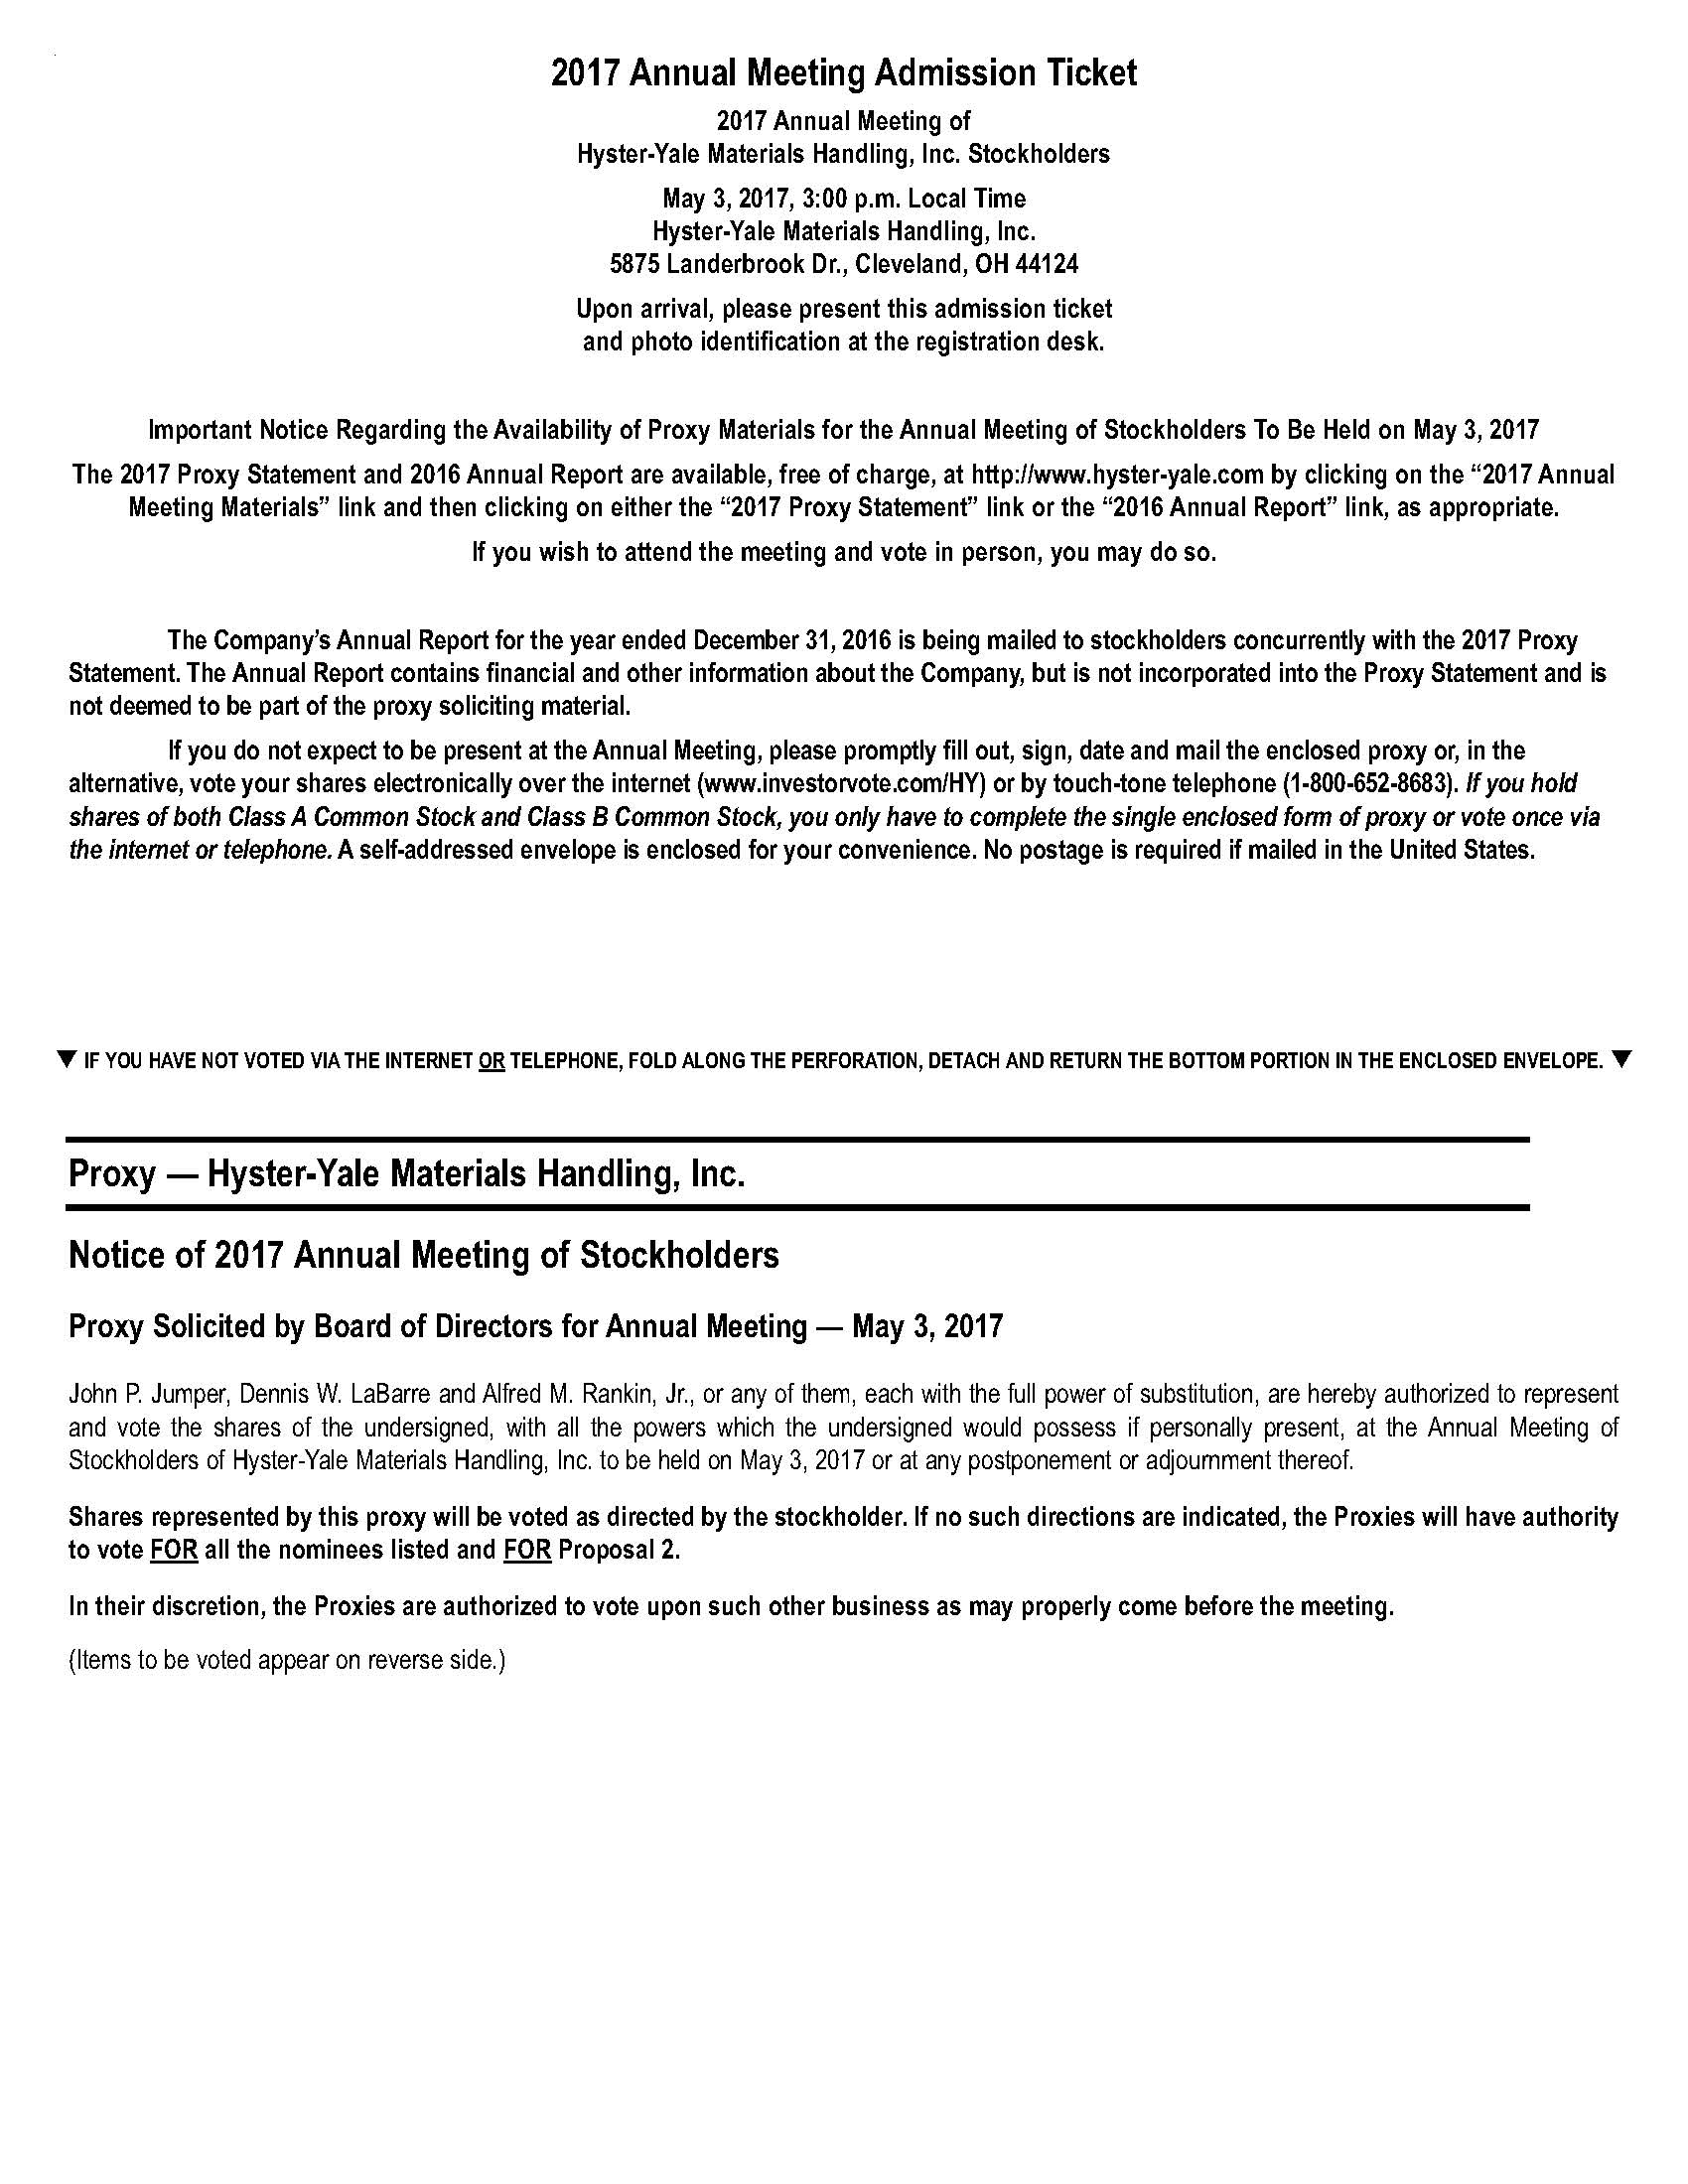
| NOTICE OF ANNUAL MEETING | ||||
| 1. | To elect |
| 2. | To confirm the appointment of Ernst & Young LLP, the independent registered public accounting firm of the Company, for the current fiscal year; and |
| 3. | To |
| Secretary |
| PROXY STATEMENT — MARCH 17, 2017 | ||||
| Composition of the Board | ||||
| Directors' Meetings and Committees | ||||
| Name | Independent | Audit Review | Compensation | Nominating and Corporate Governance | Planning Advisory | Finance | Executive | |||||||
| J.C. Butler, Jr. | No | X | ||||||||||||
| Carolyn Corvi | Yes | X | X | X | Chair | X | ||||||||
| John P. Jumper | Yes | X | Chair | X | X | |||||||||
| Dennis W. LaBarre | Yes | Chair | X | X | X | |||||||||
| F. Joseph Loughrey | Yes | Chair | X | X | X | |||||||||
| H. Vincent Poor | Yes | X | X | |||||||||||
| Alfred M. Rankin, Jr. | No | Chair | X | Chair | ||||||||||
| Claiborne R. Rankin | No | X | ||||||||||||
| John M. Stropki | Yes | X | X | |||||||||||
| Britton T. Taplin | Yes | X | ||||||||||||
| Eugene Wong | Yes | X | X | |||||||||||
| Audit Review Committee | |||
| 2016 Meetings: 6 | |||
| Members: | Ÿ | The Audit Review Committee has the responsibilities set forth in its charter, including, among | |
| others: | |||
| Carolyn Corvi | Ÿ | the quality and integrity of our financial statements; | |
| John P. Jumper | Ÿ | monitor our compliance with legal and regulatory requirements; | |
| F. Joseph Loughrey (Chair) | Ÿ | the adequacy of our internal controls; | |
| Eugene Wong | Ÿ | our guidelines and policies to monitor and control our major financial risk exposures; | |
| Ÿ | the qualifications, independence, selection and retention of the independent registered | ||
| public accounting firm; | |||
| Ÿ | the performance of our internal audit function and independent registered public | ||
| accounting firm; | |||
| Ÿ | assisting our Board of Directors and us in interpreting and applying our Corporate Compliance | ||
| Program and other issues related to corporate and employee ethics; and | |||
| Ÿ | preparing the Annual Report of the Audit Review Committee to be included in our proxy | ||
| statement. | |||
| Ÿ | No member of the Committee serves on more than three public company audit committees. | ||
| Ÿ | All members have been determined to be independent and financially literate under NYSE listing | ||
| standards and rules of the U.S. Securities and Exchange Commission (the "SEC") as applicable. | |||
| Ÿ | The Board has determined that Mr. Loughrey is an "audit committee financial expert" as defined by | ||
| the SEC and that he has accounting and related financial management expertise as required by | |||
| NYSE listing standards. | |||
| Ÿ | Given that Mr. Loughrey is not standing for re-election, the Board intends to appoint Mr. Stropki | ||
| as the Chair of the Audit Review Committee at its meeting immediately following the Annual | |||
| Meeting. In making that decision, the Board has determined that Mr. Stropki is an "audit committee | |||
| financial expert" as defined by the SEC and that he has the accounting and related financial | |||
| management expertise as required by the NYSE Listing Standards. | |||
| Nominating and Corporate Governance Committee | |||
| 2016 Meetings: 3 | |||
| Members: | Ÿ | The Nominating and Corporate Governance Committee (the "NCG Committee") has the | |
| John P. Jumper | responsibilities set forth in its charter, including, among others: | ||
| Dennis W. LaBarre (Chair) | Ÿ | the review and making of recommendations to our Board of Directors of the criteria | |
| F. Joseph Loughrey | for membership on our Board of Directors; | ||
| H. Vincent Poor | Ÿ | the review and making of recommendations to our Board of Directors of the optimum | |
| John M. Stropki | number and qualifications of directors believed to be desirable; | ||
| Ÿ | the establishment and monitoring of a system to receive suggestions for nominees to | ||
| directorships of the Company; | |||
| Ÿ | the identification and making of recommendations to our Board of Directors of | ||
| specific candidates for membership on our Board of Directors; | |||
| Ÿ | reviewing our Corporate Governance Guidelines and recommending changes as appropriate; | ||
| Ÿ | overseeing evaluations of the Board of Directors' effectiveness; | ||
| Ÿ | annually reporting to the Board of Directors its assessment of our Board's performance; and | ||
| Ÿ | considering director candidates recommended by our stockholders, see "Procedures for | ||
| Submission and Consideration of Director Candidates" on page 44. | |||
| Ÿ | All members have been determined to be independent under NYSE listing standards. | ||
| Ÿ | The NCG Committee may consult with members of the Taplin and Rankin families, including | ||
| Alfred M. Rankin, Jr., regarding the composition of our Board of Directors. | |||
| Compensation Committee | |||
| 2016 Meetings: 5 | |||
| Members: | Ÿ | The Compensation Committee has the responsibilities set forth in its charter with respect | |
| Carolyn Corvi | to the administration of our policies, programs and procedures for compensating our | ||
| John P. Jumper (Chair) | employees, including our executive officers and directors. Among other things, the | ||
| H. Vincent Poor | Compensation Committee responsibilities include: | ||
| John M. Stropki | Ÿ | the review and approval of corporate goals and objectives relevant to compensation; | |
| Eugene Wong | Ÿ | the evaluation of the performance of the Chief Executive Officer, whom we refer to | |
| as our CEO, other executive officers and senior managers in light of these goals and | |||
| objectives; | |||
| Ÿ | the determination and approval of CEO, other executive officer and senior manager | ||
| compensation levels; | |||
| Ÿ | the establishment of guidelines for administering the Company's compensation | ||
| policies and programs for all employees; | |||
| Ÿ | the consideration of whether the risks arising from our employee compensation policies and | ||
| practices are reasonably likely to have a material adverse effect on us; | |||
| Ÿ | the making of recommendations to our Board of Directors, where appropriate or required, and | ||
| the taking of other actions with respect to all other compensation matters, including incentive | |||
| compensation plans and equity-based plans; | |||
| Ÿ | the periodic review of the compensation of our Board of Directors; | ||
| Ÿ | the review and approval of the Compensation Discussion and Analysis and the preparation of | ||
| the annual Compensation Committee Report to be included in our Proxy Statement; and | |||
| Ÿ | the discharge of other duties or responsibilities as delegated by the Board of Directors. | ||
| Ÿ | All members have been determined to be independent under the NYSE listing standards and the | ||
| rules of the SEC. | |||
| Ÿ | The Compensation Committee may, in its discretion, delegate all or a portion of its duties and | ||
| responsibilities to one or more subcommittees of the Compensation Committee or, in appropriate | |||
| cases, to our senior managers. | |||
| Ÿ | The Compensation Committee retains and receives assistance in the performance of its | ||
| responsibilities from an internationally recognized compensation consulting firm, discussed below | |||
| under the heading "Compensation Consultants" on page 14. | |||
| Planning Advisory Committee | |||
| 2016 Meetings: 1 | |||
| Members: | Ÿ | The Planning Advisory Committee's responsibilities include: | |
| Alfred M. Rankin, Jr. (Chair) | Ÿ | acting as a key participant, resource and adviser on various operational matters; | |
| Carolyn Corvi | Ÿ | reviewing and advise on a preliminary basis possible acquisitions, divestitures, and other | |
| Dennis W. LaBarre | transactions identified by management for possible consideration of the full Board of Directors; | ||
| F. Joseph Loughrey | Ÿ | considering and recommending to the Board of Directors special advisory roles for Directors | |
| who are not members of the Planning Advisory Committee; and | |||
| Ÿ | providing general oversight on behalf of the Board of Directors with respect to stockholder | ||
| interests and the Company's evolving structure and stockholder base. | |||
| Finance Committee | |||
| 2016 Meetings: 4 | |||
| Members: | Ÿ | The Finance Committee responsibilities include: | |
| J.C. Butler, Jr. | Ÿ | the review of financing and financial risk management strategies for the Company and its | |
| Carolyn Corvi (Chair) | principal operating subsidiary; and | ||
| Dennis W. LaBarre | Ÿ | making recommendations to the Board on matters concerning finance. | |
| Alfred M. Rankin, Jr. | |||
| Claiborne R. Rankin | |||
| Britton T. Taplin | |||
| Executive Committee | ||
| 2016 Meetings: 0 | ||
| Members: | Ÿ | Acts on behalf of the Board of Directors on matters requiring Board action between meetings |
| Carolyn Corvi | of the full Board. | |
| John P. Jumper | Ÿ | All members, except Mr. Rankin, are independent. |
| Dennis W. LaBarre | ||
| F. Joseph Loughrey | ||
| Alfred M. Rankin, Jr. (Chair) | ||
| Board Leadership Structure | ||||
| Board Oversight of Risk Management | ||||
| Board/Committee | Primary Areas of Risk Oversight | |
| Full Board | Ÿ | Oversees overall Company risk management procedures, including operational and strategic, and regularly receives and evaluates reports and presentations from the Chairs of the Audit Review, Compensation, NCG, Planning Advisory and Finance Committees on risk-related matters falling within each respective committee's oversight responsibilities |
| Audit Review Committee | Ÿ | Oversees financial and legal risks by regularly reviewing reports and presentations given by management, including our Senior Vice President and General Counsel, Senior Vice President and Chief Financial Officer, and Director, Internal Audit, as well as other operational Company personnel, and evaluates potential related-person transactions |
| Ÿ | Regularly reviews our risk management practices and risk-related policies (for example, the Company's Code of Corporate Conduct and legal and regulatory reviews) and evaluates potential risks related to internal control over financial reporting | |
| NCG Committee | Ÿ | Oversees potential risks related to our governance practices by, among other things, reviewing succession plans and performance evaluations of the Board and CEO |
| Compensation Committee | Ÿ | Oversees potential risks related to the design and administration of our compensation plans, policies and programs, including our performance-based compensation programs, to promote appropriate incentives which do not encourage unnecessary and excessive risk-taking by our executive officers or other employees |
| Finance Committee | Ÿ | Regularly reviews risks related to financing and other risk management strategies, including reviews of our insurance portfolios |
| Planning Advisory Committee | Ÿ | Assist the Board in its oversight of the Company's key strategies, projects and initiatives |
| Code of Conduct | ||||
| Review and Approval of Related Party Transactions | ||||
| Communication with Directors | ||||
| Report of the Audit Review Committee | ||||
| PART TWO - PROPOSALS TO BE VOTED ON AT THE 2017 ANNUAL MEETING | ||||
| Election of Directors (Proposal 1) | ||||
| Director Nominee Information | ||||
| Name | Age | Principal Occupation and Business Experience During Last Five Years and other Directorships in Public Companies | Director Since* | Age | Principal Occupation and Business Experience During Last Five Years and other Directorships in Public Companies | Director Since* | ||||||
| J.C. Butler, Jr. | 53 | Senior Vice President - Finance, Treasurer and Chief Administrative Officer of NACCO Industries, Inc. (our former parent company that is an operating holding company with subsidiaries in the mining, small appliance and specialty retail industries), referred to as NACCO. From prior to 2009 to September 2012, Vice President - Corporate Development and Treasurer of NACCO. From January 2010, Senior Vice President - Project Development and Administration of The North American Coal Corporation (referred to as NACoal). From August 2011 to September 2012, Treasurer of NACCO Materials Handling Group, Inc., our principal operating subsidiary, referred to as NMHG. From prior to 2009 to January 2010, Senior Vice President - Project Development of NA Coal. With over 18 years of service as a member of management at NACCO while we were its wholly-owned subsidiary, Mr. Butler has extensive knowledge of the operations and strategies of our Company. | 2012 | 56 | Senior Vice President - Finance, Treasurer and Chief Administrative Officer of NACCO Industries, Inc. (our former parent company that is an operating holding company with subsidiaries in the mining, small appliance and specialty retail industries) ("NACCO") since October 2012. From prior to 2012 to September 2012, Vice President - Corporate Development and Treasurer of NACCO. From July 2015, President and Chief Executive Officer of The North American Coal Corporation (referred to as NACoal). From July 2014 to July 2015, Senior Vice President - Project Development, Administration and Mississippi Operations of NACoal. From prior to 2012 to June 2014, Senior Vice President - Project Development and Administration of NACoal. From prior to 2012 to September 2012, Treasurer of HYG, our principal operating subsidiary. With approximately 20 years of service as a member of management at NACCO while we were its wholly-owned subsidiary, Mr. Butler has extensive knowledge of the operations and strategies of our Company. | 2012 | ||||||
| Carolyn Corvi | 62 | Vice President and General Manager - Airplane Programs of The Boeing Company (an aerospace company) from prior to 2009. Ms. Corvi retired in January 2009. Director of United Continental Holdings, Inc. and Allegheny Technologies, Inc. From June 2009 to July 2012, Director of Goodrich Corporation. Ms. Corvi's experience in general management, including her service as vice president and general manager of a major publicly-traded corporation, enables her to make significant contributions to our Board of Directors. Through this past employment experience and her past and current service on the boards of publicly-traded corporations, she offers the Board a comprehensive perspective for developing corporate strategies and managing risks of a major publicly-traded corporation. | 2012 | 65 | Retired Vice President and General Manager - Airplane Programs of The Boeing Company (an aerospace company). Director of United Continental Holdings, Inc. and Allegheny Technologies, Inc. From prior to 2012 to July 2012, Director of Goodrich Corporation. Ms. Corvi's experience in general management, including her service as vice president and general manager of a major publicly-traded corporation, enables her to make significant contributions to our Board of Directors. Through this past employment experience and her past and current service on the boards of publicly-traded corporations, she offers the Board a comprehensive perspective for developing corporate strategies and managing risks of a major publicly-traded corporation. | 2012 | ||||||
| John P. Jumper | 72 | Retired Chief of Staff, United States Air Force. Chairman of the Board of Leidos Holdings, Inc. (an applied technology company) from 2013 to July 2015. From 2013 to July 2014, Chief Executive Officer of Leidos Holdings, Inc. From March 2012 to September 2013, Chairman and Chief Executive Officer of Science Applications International Corporation (a technology integrator providing full life cycle solutions). From prior to 2012, President, John P. Jumper & Associates (aerospace consulting). General Jumper also serves as a Director of NACCO and Leidos Holdings, Inc. From prior to 2012 to September 2013, Director of Science Applications International Corporation. From prior to 2012 until March 2012, Director of Wesco Aircraft Holding, Inc. From prior to 2012 to February 2012, Director of Jacobs Engineering, Inc. From prior to 2012 to July 2012, Director of Goodrich Corporation. Through his extensive military career, including as the highest-ranking officer in the U.S. Air Force, General Jumper developed valuable and proven leadership and management skills that make him a significant contributor to our Board. In addition, General Jumper's current and prior service on the boards of other publicly-traded corporations, as well as Chairman and Chief Executive Officer of two Fortune 500 companies, allow him to provide valuable insight to our Board on matters of corporate governance and executive compensation policies and practices. | 2012 | |||||||||
| Dennis W. LaBarre | 74 | Retired Partner of Jones Day (a law firm). From January 2014 to December 2014, Of Counsel at Jones Day. From prior to 2012 to December 2013, Partner at Jones Day. Mr. LaBarre also serves as a Director of NACCO. Mr. LaBarre is a lawyer with broad experience counseling boards and senior management of publicly-traded and private corporations regarding corporate governance, compliance and other domestic and international business and transactional issues. In addition, he has over 30 years of experience as a member of senior management of a major international law firm. These experiences enable him to provide our Board of Directors with an expansive view of legal and business issues, which is further enhanced by his extensive knowledge of us as a result of his many years of service on NACCO's board and through his involvement with its committees. | 2012 | |||||||||
| John P. Jumper | 69 | Chairman of the Board and Chief Executive Officer of Leidos Holdings, Inc. (an applied technology company) since 2013. Retired Chief of Staff, United States Air Force. From March 2012 to September 2013, Chairman and Chief Executive Officer of Science Applications International Corporation (a technology integrator providing full life cycle solutions). From prior to 2009, President, John P. Jumper & Associates (aerospace consulting). Also, Director of NACCO. From prior to 2009 to September 2013, Director of Science Applications International Corporation. From prior to 2009 until March 2012, Director of Wesco Aircraft Holding, Inc. From prior to 2009 to February 2012, Director of Jacobs Engineering, Inc. From prior to 2009 to 2012, Director of Goodrich Corporation. From prior to 2009 to 2010, Director of Somanectics Corp. From prior to 2009 to 2009, Director of Tech Team Global. Through his extensive military career, including as the highest-ranking officer in the U.S. Air Force, General Jumper developed valuable and proven leadership and management skills that make him a significant contributor to our Board. In addition, General Jumper’s service on the boards of other publicly-traded corporations, as well as Chairman and Chief Executive Officer of two Fortune 500 companies, allow him to provide valuable insight to our Board on matters of corporate governance and executive compensation policies and practices. | 2012 | |||
| Dennis W. LaBarre | 71 | Of Counsel at the law firm of Jones Day since 2014. From prior to 2009 to December 2013, Partner at Jones Day. Mr. LaBarre also serves as a Director of NACCO. Mr. LaBarre is a lawyer with broad experience counseling boards and senior management of publicly-traded and private corporations regarding corporate governance, compliance and other domestic and international business and transactional issues. In addition, he has over 30 years of experience as a member of senior management of a major international law firm. These experiences enable him to provide our Board of Directors with an expansive view of legal and business issues, which is further enhanced by his extensive knowledge of us as a result of his many years of service on NACCO’s board and through his involvement with its committees. | 1982 | |||
| F. Joseph Loughrey | 64 | Vice Chairman, Cummins, Inc., (an engine manufacturing company) from prior to 2009 to April 2009. Mr. Loughrey retired in April 2009. Chairperson of Hillenbrand, Inc. and Director of AB SKF and The Vanguard Group. Mr. Loughrey served as a Director of Sauer-Danfoss Inc. from prior to 2009 to 2010. Mr. Loughrey's experiences as a president and chief operating officer of a major public company allow him to make significant contributions to our Board. His over 35 years of experience in manufacturing at a global company have provided him with vast management and financial experience as well as important perspectives of running a global business. | 2013 | |||
| Alfred M. Rankin, Jr. | 72 | Chairman, President and Chief Executive Officer of the Company and Chairman of NMHG. Chairman, President and Chief Executive Officer of NACCO. Chairman of the Board of each of NACCO’s principal subsidiaries: NA Coal, Hamilton Beach Brands, Inc. and The Kitchen Collection, LLC. Also, Director of The Vanguard Group. From prior to 2009 to 2012, Director of the Board of Directors of the Federal Reserve Bank of Cleveland and from 2010 to 2012, Chairman of the Board of Directors of the Federal Reserve Bank of Cleveland. From prior to 2009 to 2012, Director of Goodrich Corporation. In over 40 years of service to NACCO, our former parent company, as a Director and over 25 years in senior management of NACCO, Mr. Rankin has amassed extensive knowledge of all of our strategies and operations. In addition to his extensive knowledge of the Company, he also brings to our Board unique insight resulting from his service on the boards of other publicly-traded corporations and the Federal Reserve Bank of Cleveland. Additionally, through his dedicated service to many of Cleveland’s cultural institutions, he provides a valuable link between our Board, the Company and the community surrounding our corporate headquarters. | 1972 | |||
| Claiborne R. Rankin | 63 | Manager of NCAF Management, LLC, the managing member of North Coast Angel Fund, LLC (a private firm specializing in venture capital and investments). Managing Member of Sycamore Partners, LLC, the manager of NCAF Management II, LLC and managing member of North Coast Angel Fund II, LLC (private firms specializing in venture capital and investments). Since 2014, Executive Chairman and Acting President of SironRX Theraputics, Inc. (a privately-held biotechnology company). From prior to 2009, Director of NMHG. Mr. Rankin is the grandson of the founder of NACCO. As a member of the board of NMHG for more than 20 years, Mr. Rankin has extensive knowledge of the lift truck industry and the Company. This experience and knowledge, his venture capital experience and the perspective of a long-term stockholder enable him to contribute to our Board of Directors. | 1994 | |||
| Name | Age | Principal Occupation and Business Experience During Last Five Years and other Directorships in Public Companies | Director Since* | |||
| H. Vincent Poor | 65 | Michael Henry Strater University Professor of Electrical Engineering from prior to 2012 to present; Professor of Electrical Engineering from prior to 2012 to present; Associated Faculty, Princeton Environmental Institute from prior to 2012 to present; Associated Faculty, department of Operations Research & Financial Engineering from prior to 2012 to present; Associated Faculty, Program in Applied and Computational Mathematics from prior to 2012 to present; Associated Faculty, Andlinger Center for Energy and Environment from 2012 to present; Dean, School of Engineering and Applied Science from prior to 2012 to 2016; Director, IEEE Foundation from 2015 to Present; Director, Corporation for National Research Initiatives from 2012 to present; Chair of the Engineering Section of American Association for the Advancement of Science from prior to 2012 to 2012; and Chair of the Signal Processing Society Awards Board from 2017 to present. A member of the U.S. National Academy of Engineering and a former Guggenheim Fellow. Dr. Poor’s broad experience in the fields of robust statistical signal processing, multi-user detection and non-Gaussian signal processing have opened new horizons in wireless communications and related fields. In this context, his extensive skills and knowledge allow him to provide valuable insight to our Board on matters related to telemetry and electrical engineering. | 2017 | |||
| Alfred M. Rankin, Jr. | 75 | Chairman, President and Chief Executive Officer of the Company and Chairman of HYG. Chairman, President and Chief Executive Officer of NACCO. Chairman of the Board of NACCO and each of NACCO's principal subsidiaries: NACoal, Hamilton Beach Brands, Inc. and The Kitchen Collection, LLC from prior to 2012. From prior to 2012 to October 2014, Director of The Vanguard Group. From prior to 2012 to 2012, Director of the Board of Directors of the Federal Reserve Bank of Cleveland and from prior to 2012 to 2012, Chairman of the Board of Directors of the Federal Reserve Bank of Cleveland. From prior to 2012 to July 2012, Director of Goodrich Corporation. In over 40 years of service to NACCO, our former parent company, as a Director and over 25 years in senior management of NACCO, Mr. Rankin has amassed extensive knowledge of all of our strategies and operations. In addition to his extensive knowledge of the Company, he also brings to our Board unique insight resulting from his service on the boards of other publicly-traded corporations, The Vanguard Group and the Federal Reserve Bank of Cleveland. Additionally, through his dedicated service to many of Cleveland's cultural institutions, he provides a valuable link between our Board, the Company and the community surrounding our corporate headquarters. Mr. Rankin is also the grandson of the founder of NACCO and additionally brings the perspective of a long-term stockholder to our Board. | 2012 | |||
| Claiborne R. Rankin | 66 | Manager of NCAF Management, LLC, the managing member of North Coast Angel Fund, LLC (a private firm specializing in venture capital and investments) from prior to 2012. Managing Member of Sycamore Partners, LLC, the manager of NCAF Management II, LLC and managing member of North Coast Angel Fund II, LLC (private firms specializing in venture capital and investments) from prior to 2012. Mr. Rankin is the grandson of the founder of NACCO. As a member of the board of HYG for more than 20 years, Mr. Rankin has extensive knowledge of the lift truck industry and the Company. This experience and knowledge, his venture capital experience and the perspective of a long-term stockholder enable him to contribute to our Board of Directors. | 2012 | |||
| John M. Stropki | 66 | Executive Chairman, Lincoln Electric Holding, Inc. (a welding products company) from December 2012 to December 2013. Mr. Stropki retired in December 2013. From prior to 2012 to December 2012, Chairman, President and Chief Executive Officer of Lincoln Electric Holding, Inc. Also, Director of the Sherwin Williams Company and Rexnord Corporation. Mr. Stropki's experience as a president and chief executive officer of a publicly traded corporation allows him to make significant contributions to our Board of Directors. His 40 years of experience at Lincoln Electric have provided him with vast management, manufacturing and leadership skills in an industrial company as well as important perspectives on operating a business in a global market. | 2013 | |||
| Britton T. Taplin | 60 | Self-employed (personal investments) from prior to 2012. Mr. Taplin also serves as a Director of NACCO. Mr. Taplin is the grandson of the founder of NACCO and brings the perspective of a long-term stockholder to our Board of Directors. | 2012 | |||
| Michael E. Shannon | 77 | President of MEShannon & Associates, Inc. (a private firm specializing in corporate finance and investments). Retired Chairman, Chief Financial and Administrative Officer of Ecolab, Inc. (a specialty chemicals company). From prior to 2009 to April 2010, Director of CenterPoint Energy, Inc. Mr. Shannon formerly served as a Director of NACCO from prior to 2009 to September, 2012. Mr. Shannon’s experience in finance and general management, including his service as chairman and chief financial and administrative officer of a major publicly-traded corporation, enables him to make significant contributions to our Board. Through his past and current service on the boards of publicly-traded corporations, he has a broad and deep understanding of the financial reporting system, the challenges involved in developing and maintaining effective internal controls and the isolation of areas of focus for evaluating risks to the Company. | 2002 | |||
| John M. Stropki | 63 | Executive Chairman, Lincoln Electric Holding, Inc. (a welding products company) from December 2012 to December 2013. Mr. Stropki retired in December 2013. From prior to 2009 to December 2012, Chairman, President and Chief Executive Officer of Lincoln Electric Holding, Inc. Also, Director of the Sherwin Williams Company and Rexnord Corporation. Mr. Stropki's experience as a president and chief executive officer of a publicly traded corporation allows him to make significant contributions to our Board of Directors. His 40 years of experience at Lincoln Electric have provided him vast management, manufacturing and leadership skills in an industrial company as well as important perspectives in operating a business in a global market. | 2013 | |||
| Britton T. Taplin | 57 | Self-employed (personal investments). Mr. Taplin also serves as a Director of NACCO. Mr. Taplin is the grandson of the founder of NACCO and brings the perspective of a long-term stockholder to our Board of Directors. | 1992 | |||
| Eugene Wong | 79 | Professor Emeritus of the University of California at Berkeley. Dr. Wong formerly served as a Director of NACCO from prior to 2009 to September, 2012. Dr. Wong has broad experience in engineering, particularly in the areas of electrical engineering and software design, which are of significant value to the oversight of our information technology infrastructure, product development and general engineering. He has served as technical consultant to a number of leading and developing nations, which enables him to provide an up-to-date international perspective to our Board of Directors. Dr. Wong has also co-founded and managed several corporations, and has served as a chief executive officer of one, enabling him to contribute the administrative and management perspective of a corporate chief executive officer. | 2005 | |||
| Name | Age | Principal Occupation and Business Experience During Last Five Years and other Directorships in Public Companies | Director Since* | |||
| Eugene Wong | 82 | Professor Emeritus of the University of California at Berkeley from prior to 2012. Dr. Wong formerly served as a Director of NACCO from prior to 2012 to September 2012. Dr. Wong has broad experience in engineering, particularly in the areas of electrical engineering and software design, which are of significant value to the oversight of our information technology infrastructure, product development and general engineering. He has served as technical consultant to a number of leading and developing nations, which enables him to provide an up-to-date international perspective to our Board of Directors. Dr. Wong has also co-founded and managed several corporations, and has served as a chief executive officer of one, enabling him to contribute an administrative and management perspective of a corporate chief executive officer. | 2012 | |||
| Director Compensation | ||||
| Name | Fees Earned or Paid in Cash ($)(1) | Stock Awards ($)(2) | All Other Compensation ($)(3) | Total ($) | Fees Earned or Paid in Cash ($)(1) | Stock Awards ($)(2) | All Other Compensation ($)(3) | Total ($) | ||||||||
| J.C. Butler, Jr. | $80,118 | $76,320 | $4,351 | $160,789 | $87,086 | $108,074 | $4,327 | $199,487 | ||||||||
| Carolyn Corvi | $102,118 | $76,320 | $4,397 | $182,835 | $118,586 | $108,074 | $5,564 | $232,224 | ||||||||
| John P. Jumper | $99,118 | $76,320 | $4,351 | $179,789 | $114,086 | $108,074 | $4,248 | $226,408 | ||||||||
| Dennis W. LaBarre | $92,118 | $76,320 | $4,272 | $172,710 | $121,586 | $108,074 | $4,248 | $233,908 | ||||||||
| F. Joseph Loughrey | $19,569 | $18,101 | $4,372 | $42,042 | $104,586 | $108,074 | $5,564 | $218,224 | ||||||||
| Claiborne R. Rankin | $74,118 | $76,320 | $5,397 | $155,835 | $79,086 | $108,074 | $5,564 | $192,724 | ||||||||
| Michael E. Shannon | $107,118 | $76,320 | $5,273 | $188,711 | ||||||||||||
| John M. Stropki (4) | $20,569 | $18,101 | $2,872 | $41,542 | ||||||||||||
| John M. Stropki | $21,167 | $182,221 | $5,564 | $208,952 | ||||||||||||
| Britton T. Taplin | $74,118 | $76,320 | $5,397 | $155,835 | $79,086 | $108,074 | $5,564 | $192,724 | ||||||||
| Eugene Wong | $21,271 | $149,299 | $5,273 | $175,843 | $24,167 | $182,221 | $4,406 | $210,794 | ||||||||
| (1) | The amounts in this column reflect the annual retainers and other fees earned by our directors for services rendered in |
| (2) | Under the Non-Employee |
| (3) | The amount listed includes: (i) |
| Section 16(a) Beneficial Ownership Reporting Compliance | ||||
| Confirmation of Appointment of Ernst & Young LLP, the Independent Registered Public Accounting Firm of the Company, for the Current Fiscal Year (Proposal 2) | ||||
| PART THREE - EXECUTIVE COMPENSATION INFORMATION | ||||
| Summary of Our Executive Compensation Program | ||||
| At our 2016 annual meeting of stockholders, the Company received strong support for our compensation program with over 94% of the votes cast approving our advisory vote on named executive officer compensation. The Compensation Committee believes that this overwhelming support reinforces the philosophy and objectives of our executive compensation program. | ||||
| What We Do | What We Do Not Do |
| Equity compensation awards generally must be held for 10 years - Equity awards cannot be pledged, hedged or transferred during this time. | We do not provide our NEOs with employment or individual change in control agreements. |
| We provide limited change in control protections under our incentive and nonqualified deferred compensation plans that (i) accelerate the time of payment of previously vested incentive benefits and non-qualified retirement benefits and (ii) provide for pro-rata target incentive payments for the year of the change in control. | We do not provide any tax gross-ups except for certain relocation expenses and under one non-qualified retirement plan that was frozen in 2007. |
| We provide a modest level of perquisites, the majority of which are paid in cash, that are determined based on market reasonableness. | We do not provide our NEOs with any minimum or guaranteed bonuses. |
| We use an independent compensation consultant. | We do not take into account our long-term awards when determining our defined contribution retirement benefits. |
| We set our target compensation at the 50th percentile of our chosen benchmark and deliver compensation above or below this level based on performance. | We do not have any active defined benefit plans and only gave our NEOs credit for time worked under our frozen pension plans. |
| Compensation Discussion and Analysis | ||||
| Name (1) | Titles | |
| Alfred M. Rankin, Jr. | Chairman, President and CEO – Hyster-Yale Chairman – | |
| Kenneth C. Schilling | Senior Vice President and Chief Financial Officer – Hyster-Yale Senior Vice President and Chief Financial Officer – | |
| Colin Wilson | President President and CEO – HYG | |
| Charles F. Pascarelli | Senior Vice President, President, Americas | |
| Rajiv K. Prasad | Senior Vice President, Global Product Development, – | |
| Named Executive Officer | (A) Salary Midpoint ($)(%) | (B) Cash in Lieu of Perquisites ($)(%)(1) | (C) Short-Term Plan Target ($)(%) | (D) Long-Term Plan Target ($)(%)(2) | (A)+(B)+(C)+(D) Target Total Compensation ($) | (A) Salary Midpoint ($)(%) | (B) Cash in Lieu of Perquisites ($)(%)(1) | (C) Short-Term Plan Target ($)(%) | (D) Long-Term Plan Target ($)(%)(2) | (A)+(B)+(C)+(D) Target Total Compensation ($) | |||||||||||||
| Alfred M. Rankin, Jr. (3) | $620,340 | 17.5% | $30,000 | 1% | $620,340 | 17.5% | $2,282,851 | 64% | $3,553,531 | $764,925 | 19% | $33,750 | 1% | $764,925 | 19% | $2,507,042 | 61% | $4,070,642 | |||||
| Kenneth C. Schilling | $359,000 | 43% | $20,000 | 2% | $161,550 | 20% | $288,995 | 35% | $829,545 | $389,200 | 43% | $20,000 | 2% | $194,600 | 21% | $313,306 | 34% | $917,106 | |||||
| Michael P. Brogan | $686,400 | 29% | $40,000 | 2% | $480,480 | 20% | $1,184,040 | 49% | $2,390,920 | ||||||||||||||
| Colin Wilson (4) | $546,500 | 37% | $35,000 | 2% | $284,460 | 19% | $624,519 | 42% | $1,490,479 | ||||||||||||||
| Colin Wilson | $748,500 | 28% | $40,000 | 2% | $598,800 | 22% | $1,291,163 | 48% | $2,678,463 | ||||||||||||||
| Charles F. Pascarelli | $456,600 | 38% | $20,000 | 2% | $251,130 | 21% | $472,581 | 39% | $1,200,311 | ||||||||||||||
| Rajiv K. Prasad | $381,300 | 43% | $20,000 | 2% | $171,585 | 20% | $306,947 | 35% | $879,832 | $456,600 | 38% | $20,000 | 2% | $251,130 | 21% | $472,581 | 39% | $1,200,311 | |||||
| (1) | In addition to providing car allowances to senior employees outside the U.S. and other perquisites to a limited number of employees in unique circumstances, U.S. senior management employees are paid a fixed dollar amount of cash in lieu of perquisites. The applicable dollar amounts |
| (2) | The amounts shown include a 15% increase from the |
| (3) |
| 2016 Mr. A. Rankin Target Compensation | (A) Salary Midpoint | (B) Cash in Lieu of Perquisites | (C) Short-Term Plan Target (100%) | (D) Equity Long-Term Plan Target (285%) + 15% increase | (A) + (B) + (C) + (D) Target Total Compensation | |||||
| Hay-Recommended Amounts | $1,019,900 | $45,000 | $1,019,900 | $3,342,722 | $5,427,522 | |||||
| Adjusted Amounts Determined by Compensation Committee (25% reduction - as reflected on table above) | $764,925 | $33,750 | $764,925 | $2,507,042 | $4,070,642 | |||||
| Named Executive Officer | Salary Midpoint Determined by the Hay Group ($) | Salary Range (As % of Salary Midpoint) Determined by the Compensation Committee (%) | Base Salary For 2013 and as a Percentage of Salary Midpoint ($)(%) | Change Compared to 2012 Base Salary (%) | Salary Midpoint Determined by the Hay Group ($) | Base Salary For 2016 and as a Percentage of Salary Midpoint ($)(%) | Change Compared to 2015 Base Salary (%) | |||||||||
| Alfred M. Rankin, Jr. (1) | $620,340 | 80% - 130% | $746,400 | 120% | 3.5% | $764,925 | $839,540 | 110% | 3.5% | |||||||
| Kenneth C. Schilling | $359,000 | 80% - 120% | $326,786 | 91% | 9.4% | $389,200 | $374,693 | 96% | 4.0% | |||||||
| Michael P. Brogan | $686,400 | 80% - 120% | $606,252 | 88% | 7.0% | |||||||||||
| Colin Wilson (3) | $546,500 | 80% - 120% | $498,969 | 91% | 6.4% | |||||||||||
| Colin Wilson | $748,500 | $630,000 | 84% | 5.0% | ||||||||||||
| Charles F. Pascarelli | $456,600 | $432,631 | 95% | 3.0% | ||||||||||||
| Rajiv K. Prasad | $381,300 | 80% - 120% | $354,916 | 93% | 5.0% | $456,600 | $443,337 | 97% | 5.0% | |||||||
| (1) | The Compensation Committee reduced Mr. A. Rankin's salary midpoint |
| 2013 Net income | $ | 110.0 | |
| Plus: 2013 Interest expense, net | 7.2 | ||
| Less: Income taxes on 2013 interest expense, net at 38% | (2.7 | ) | |
| Earnings Before Interest After-Tax | $ | 114.5 | |
| 2013 Average stockholders' equity (12/31/2012 and each of 2013's quarter ends) | $ | 389.7 | |
| 2013 Average debt (12/31/2012 and each of 2013's quarter ends) | 121.4 | ||
| Less: 2013 Average cash (12/31/2012 and each of 2013's quarter ends) | (161.1 | ) | |
| Total Capital Employed | $ | 350.0 | |
| ROTCE (Before Adjustments) | 32.7 | % | |
| Plus: Adjustments to Earnings Before Interest After-Tax | $ | 6.2 | |
| Adjusted Consolidated ROTCE | 34.5 | % | |
| 2016 Net income | $ | 42.8 | |
| Plus: 2016 Interest expense, net | 4.7 | ||
| Less: Income taxes on 2016 interest expense, net at 38% | (1.8 | ) | |
| Earnings Before Interest After-Tax | $ | 45.7 | |
| 2016 Average stockholders' equity (12/31/2015 and each of 2016's quarter ends) | $ | 483.6 | |
| 2016 Average debt (12/31/2015 and each of 2016's quarter ends) | 126.1 | ||
| Less: 2016 Average cash (12/31/2015 and each of 2016's quarter ends) | (94.6 | ) | |
| Total Capital Employed | $ | 515.1 | |
| Consolidated ROTCE (Before Adjustments) | 8.9 | % | |
| Plus: Adjustments to Earnings Before Interest After-Tax | $ | 25.9 | |
| Less: Adjustments to Total Capital Employed | $ | (115.4 | ) |
| Adjusted Consolidated ROTCE | 17.9 | % | |
| Named Executive Officer | (A) 2013 Salary Midpoint ($) | (B) Short-Term Plan Target as a % of Salary Midpoint (%) | (C) = (A) x (B) Short-Term Plan Target ($) | (D) 2013 Short-Term Plan Payout (%) | (E) = (C) x (D) Short-Term Plan Payout ($) | (F) = (E)/(A)Short-Term Plan Payout as a % of Salary Midpoint (%) | (A) 2016 Salary Midpoint ($) | (B) Short-Term Plan Target as a % of Salary Midpoint (%) | (C) = (A) x (B) Short-Term Plan Target ($) | (D) 2016 Short-Term Plan Payout (%) (1) | (E) = (C) x (D) Short-Term Plan Payout ($) | (F) = (E)/(A) Short-Term Plan Payout as a % of Salary Midpoint | |||||||||||
| Alfred M. Rankin, Jr. | $620,340 | 100% | $620,340 | 115.5% | $716,493 | 115.5% | $764,925 | 100.0% | $764,925 | 53.0% | $405,410 | 53.0% | |||||||||||
| Kenneth C. Schilling | $359,000 | 45% | $161,550 | 115.5% | $186,590 | 52.0% | $389,200 | 50.0% | $194,600 | 55.3% | $107,614 | 27.7% | |||||||||||
| Michael P. Brogan | $686,400 | 70% | $480,480 | 115.5% | $554,954 | 80.8% | |||||||||||||||||
| Colin Wilson (2) | $517,200 | 55% | $284,460 | 115.5% | $328,551 | 63.5% | |||||||||||||||||
| Colin Wilson | $748,500 | 80.0% | $598,800 | 53.0% | $317,364 | 42.4% | |||||||||||||||||
| Charles F. Pascarelli (2) | $456,600 | 55.0% | $251,130 | 59.8% | $150,176 | 32.9% | |||||||||||||||||
| Rajiv K. Prasad | $381,300 | 45% | $171,585 | 115.5% | $198,181 | 52.0% | $456,600 | 55.0% | $251,130 | 46.2% | $116,022 | 25.4% | |||||||||||
| (1) |
| (2) | Mr. |
| Performance Criteria | (A) Weighting | Performance Target | Performance Result | (B) Achievement Percentage | (A) x (B) Payout Percentage | (A) Weighting | Performance Target | Performance Result | (B) Achievement Percentage | (A) x (B) Payout Percentage | |||||||
| Adjusted Operating Profit Dollars - Global | 30% | $108,546,548 | $137,321,244 | 148.6% | 44.6% | 20% | $119,698,624 | $82,404,426 | 37.7% | 7.5% | |||||||
| Adjusted Operating Profit Percent - Global | 20% | — | — | 80.7% | 16.1% | 20% | 4.6% | 3.4% | 63.8% | 12.8% | |||||||
| Adjusted ROTCE - Global | 20% | — | — | 150.0% | 30.0% | 20% | 22.1% | 18.1% | 81.9% | 16.4% | |||||||
| Market Share - Americas w/o Brazil | 12% | — | — | 70.0% | 8.4% | ||||||||||||
| Market Share - Brazil | 3% | — | — | 102.4% | 3.1% | ||||||||||||
| Market Share - EMEA | 9% | — | — | 85.0% | 7.7% | ||||||||||||
| Market Share - Americas - Class 1 & 2 | (1) | 8.4% | — | 59.4% | 5.0% | ||||||||||||
| Market Share - Americas - Class 3 | (1) | 4.2% | — | 0.0% | |||||||||||||
| Market Share - Americas - Class 4 & 5 | (1) | 8.4% | — | 150.0% | 12.6% | ||||||||||||
| Market Share - EMEA - Class 1 & 2 | (1) | 4% | — | 25.0% | 1.0% | ||||||||||||
| Market Share - EMEA - Class 3 | (1) | 2% | — | 0.0% | |||||||||||||
| Market Share - EMEA - Class 4 & 5 | (1) | 4% | — | 150.0% | 6.0% | ||||||||||||
| Market Share - Asia | 2% | — | — | 50.0% | 1.0% | 4% | — | 0.0% | |||||||||
| Market Share - Pacific | 3% | — | — | 142.9% | 4.3% | 3% | — | 42.0% | 1.3% | ||||||||
| Market Share - China | 1% | — | 150.0% | 1.5% | |||||||||||||
| Market Share - Japan | 1% | — | — | 25.0% | 0.3% | 1% | — | 86.7% | 0.9% | ||||||||
| Final Payout Percentage - Corporate | 115.5 | % | |||||||||||||||
| U.S. Corporate Total (2) | 65.0% | ||||||||||||||||
| Final Payout Percentage with Operating Profit Percent Over-Ride (2) | 55.3% | ||||||||||||||||
| (1) | In 2016, market share for the Americas and EMEA regions was separated by truck class (Class 1 & 2, Class 3 and Class 4 & 5) in order to maintain participant motivation and heighten efforts to drive business towards a richer revenue/margin mix. |
| (2) | Based on the application of the performance criteria in the above-table, the initial payout percentage under the Short-Term Plan for Mr. Schilling was 65%. Because the Company failed to achieve at least 4% adjusted operating profit percent for 2016, the payout percentage for Mr. Schilling was reduced to 85% of the initial payout percentage in accordance with the Short-Term Plan's operating profit percent over-ride feature. |
| Performance Criteria | Initial Weighting at Performance Group Level | Weighting | (A) Payment Factor | Performance Target | Performance Result | (B) Achievement Percentage | (A) x (B) Payout Percentage | |
| Adjusted Operating Profit Dollars - Global | 20% | 95% | 19.0% | $119,698,624 | $82,404,426 | 37.7% | 7.2% | |
| Adjusted Operating Profit Percent - Global | 20% | 95% | 19.0% | 4.6% | 3.4% | 63.8% | 12.1% | |
| Adjusted ROTCE - Global | 20% | 95% | 19.0% | 22.1% | 18.1% | 81.9% | 15.6% | |
| Market Share - Americas - Class 1 & 2 | (1) | 8.4% | 95% | 8.0% | — | — | 59.4% | 4.7% |
| Market Share - Americas - Class 3 | (1) | 4.2% | 95% | 4.0% | — | — | 0.0% | 0.0% |
| Market Share - Americas - Class 4 & 5 | (1) | 8.4% | 95% | 8.0% | — | — | 150.0% | 12.0% |
| Market Share - EMEA - Class 1 & 2 | (1) | 4% | 95% | 3.8% | — | — | 25.0% | 1.0% |
| Market Share - EMEA - Class 3 | (1) | 2% | 95% | 1.9% | — | — | 0.0% | 0.0% |
| Market Share - EMEA - Class 4 & 5 | (1) | 4% | 95% | 3.8% | — | — | 150.0% | 5.7% |
| Market Share - Asia | 4% | 95% | 3.8% | — | — | 0.0% | 0.0% | |
| Market Share - Pacific | 3% | 95% | 2.9% | — | — | 42.0% | 1.2% | |
| Market Share - China | 1% | 95% | 0.9% | — | — | 150.0% | 1.4% | |
| Market Share - Japan | 1% | 95% | 0.9% | — | — | 86.7% | 0.8% | |
| U.S. Corporate Total | 61.7% | |||||||
| Adjusted Operating Profit Dollars - Nuvera | 25% | 5% | 1.2% | $(25,500,000) | $(39,594,709) | 0.0% | 0.0% | |
| Nuvera Performance | 75% | 5% | 3.8% | — | — | 15.6% | 0.6% | |
| Nuvera Total | 0.6% | |||||||
| Payout Percentage (2) | 62.3% | |||||||
| Final Payout Percentage with Operating Profit Percent Over-Ride (2) | 53.0% | |||||||
| (1) | In 2016, market share for the Americas and EMEA regions was separated by truck class (Class 1 & 2, Class 3 and Class 4 & 5) in order to maintain participant motivation and heighten efforts to drive business towards a richer revenue/margin mix. |
| (2) | Based on the application of the performance criteria in the above-table, the initial payout percentage under the Short-Term Plan for Messrs. A. Rankin and Wilson was 62.3%. Because the Company failed to achieve at least 4% adjusted operating profit percent for 2016, the payout percentage for Messrs. A. Rankin and Wilson was reduced to 85% of the initial payout percentage in accordance with the Short-Term Plan's operating profit percent over-ride feature. |
| Performance Criteria | Initial Weighting at Performance Group Level | Weighting | (A) Payment Factor | Performance Target | Performance Result | (B) Achievement Percentage | (A) x (B) Payout Percentage | |
| Adjusted Operating Profit Dollars - Global | 20% | 80% | 16.0% | $119,698,624 | $82,404,426 | 37.7% | 6.1% | |
| Adjusted Operating Profit Percent - Global | 20% | 80% | 16.0% | 4.6% | 3.4% | 63.8% | 10.2% | |
| Adjusted ROTCE - Global | 20% | 80% | 16.0% | 22.1% | 18.1% | 81.9% | 13.1% | |
| Market Share - Americas - Class 1 & 2 | (1) | 8.4% | 80% | 6.7% | — | — | 59.4% | 4.0% |
| Market Share - Americas - Class 3 | (1) | 4.2% | 80% | 3.4% | — | — | 0.0% | 0.0% |
| Market Share - Americas - Class 4 & 5 | (1) | 8.4% | 80% | 6.7% | — | — | 150.0% | 10.1% |
| Performance Criteria | Initial Weighting at Performance Group Level | Weighting | (A) Payment Factor | Performance Target | Performance Result | (B) Achievement Percentage | (A) x (B) Payout Percentage | |
| Market Share - EMEA - Class 1 & 2 | (1) | 4% | 80% | 3.2% | — | — | 25.0% | 0.8% |
| Market Share - EMEA - Class 3 | (1) | 2% | 80% | 1.6% | — | — | 0.0% | 0.0% |
| Market Share - EMEA - Class 4 & 5 | (1) | 4% | 80% | 3.2% | — | — | 150.0% | 4.8% |
| Market Share - Asia | 4% | 80% | 3.2% | — | — | 0.0% | 0.0% | |
| Market Share - Pacific | 3% | 80% | 2.4% | — | — | 42.0% | 1.0% | |
| Market Share - China | 1% | 80% | 0.8% | — | — | 150.0% | 1.2% | |
| Market Share - Japan | 1% | 80% | 0.8% | — | — | 86.7% | 0.7% | |
| U.S. Corporate Total | 52.0% | |||||||
| Adjusted Operating Profit Dollars - Nuvera | 25% | 20% | 5.0% | $(25,500,000) | $(39,594,709) | 0.0% | 0.0% | |
| Nuvera Performance | 75% | 20% | 15.0% | — | — | 15.6% | 2.3% | |
| Nuvera Total | 2.3% | |||||||
| Payout Percentage (2) | 54.3% | |||||||
| Final Payout Percentage with Operating Profit Percent Over-Ride (2) | 46.2% | |||||||
| (1) | In 2016, market share for the Americas and EMEA regions was separated by truck class (Class 1 & 2, Class 3 and Class 4 & 5) in order to maintain participant motivation and heighten efforts to drive business towards a richer revenue/margin mix. |
| (2) | Based on the application of the performance criteria in the above-table, the initial payout percentage under the Short-Term Plan for Mr. Prasad was 54.3%. Because the Company failed to achieve at least 4% adjusted operating profit percent for 2016, the payout percentage for Mr. Prasad was reduced to 85% of the initial payout percentage in accordance with the Short-Term Plan's operating profit percent over-ride feature. |
| Performance Criteria | (A) Weighting | Performance Target | Performance Result | (B) Achievement Percentage | (A) x (B) Payout Percentage | |||||
| Adjusted Operating Profit Dollars - Americas | 20% | $115,000,516 | $79,214,999 | 37.8% | 7.6% | |||||
| Adjusted Operating Profit Percent - Global | 20% | 4.6% | 3.4% | 63.8% | 12.8% | |||||
| Adjusted ROTCE - Global | 20% | 22.1% | 18.1% | 81.9% | 16.4% | |||||
| Market Share - Americas - Class 1 & 2 | (1) | 16% | — | — | 59.4% | 9.5% | ||||
| Market Share - Americas - Class 3 | (1) | 8% | — | — | 0.0% | 0.0% | ||||
| Market Share - Americas - Class 4 & 5 | (1) | 16% | — | — | 150.0% | 24.0% | ||||
| Payout Percentage - Americas (2) | 70.3% | |||||||||
| Final Payout Percentage with Operating Profit Percent Over-Ride (2) | 59.8% | |||||||||
| (1) | In 2016, market share for the Americas and EMEA regions was separated by truck class (Class 1 & 2, Class 3 and Class 4 & 5) in order to maintain participant motivation and heighten efforts to drive business towards a richer revenue/margin mix. |
| (2) | Based on the application of the performance criteria in the above-table, the initial payout percentage under the Short-Term Plan for Mr. Pascarelli was 70.3%. Because the Company failed to achieve at least 4% adjusted operating profit percent for 2016, the initial payout percentage for Mr. Pascarelli was reduced to 85% of the initial payout percentage in accordance with the Short-Term Plan's operating profit percent over-ride feature. |
| • | the average closing price of our Class A Common stock on the NYSE at the end of each week during the |
| Named Executive Officer | (A) Salary Midpoint ($) | (B) Long-Term Plan Target as a Percentage of Salary Midpoint (%) | (C)=(A) x (B) Long-Term Plan Target ($) | (D) 2013 Equity Long-Term Plan Payout (%) | (E) = (C) x (D) Cash-Denominated Long-Term Plan Payout ($)(2) | (F)=(E)/(A) Cash-Denominated Long- Term Plan Payout as a Percentage of Salary Midpoint (%) | (G) Fair Market Value of Long-Term Plan Payout ($)(2) | (A) Salary Midpoint ($) | (B) Long-Term Plan Target as a Percentage of Salary Midpoint (%)(1) | (C)=(A) x (B) Long-Term Plan Target ($)(2) | (D) 2016 Long-Term Plan Payout (%) | (E) = (C) x (D) Cash-Denominated Long-Term Plan Payout ($)(2) | (F)=(E)/(A) Cash-Denominated Long- Term Plan Payout as a Percentage of Salary Midpoint (%) | (G) Fair Market Value of Long-Term Plan Payout ($)(2) | ||||||||
| Alfred M. Rankin, Jr. | $620,340 | 368.0% | $2,282,851 | 113.3% | $2,586,470 | 416.94% | $5,103,787 | $764,925 | 327.75% | $2,507,042 | 48.4% | $1,213,408 | 158.6% | $1,231,566 | ||||||||
| Kenneth C. Schilling | $359,000 | 80.5% | $288,995 | 113.3% | $327,431 | 91.21% | $646,109 | $389,200 | 80.50% | $313,306 | 48.4% | $151,640 | 39.0% | $153,909 | ||||||||
| Michael P. Brogan | $686,400 | 172.5% | $1,184,040 | 113.3% | $1,341,517 | 195.44% | $2,647,167 | |||||||||||||||
| Colin Wilson (3) | $517,200 | 120.75% | $624,519 | 113.3% | $707,580 | 136.81% | $1,396,242 | |||||||||||||||
| Colin Wilson | $748,500 | 172.50% | $1,291,163 | 48.4% | $624,923 | 83.5% | $634,275 | |||||||||||||||
| Charles F. Pascarelli (3) | $456,600 | 103.50% | $472,581 | 52.1% | $246,215 | 53.9% | $249,898 | |||||||||||||||
| Rajiv K. Prasad | $381,300 | 80.5% | $306,947 | 113.3% | $347,771 | 91.21% | $686,242 | $456,600 | 103.50% | $472,581 | 48.4% | $228,729 | 50.1% | $232,152 | ||||||||
| (1) |
| (2) | Awards under the Equity Long-Term Plan are initially denominated in dollars. The amounts shown in columns (C) and (E) reflect the |
| (3) | Mr. |
| ` | (A) Weighting | Performance Target | Performance Result | (B) Achievement Percentage | (A) x (B) Payout Percentage | |||||
| Adjusted Operating Profit Percent - Global | 50% | — | — | 63.8% | 31.9% | |||||
| Market Share - Americas - Class 1 & 2 | (1) | 10.8% | — | — | 43.2% | 4.7% | ||||
| Market Share - Americas - Class 3 | (1) | 5.4% | — | — | 0.0% | 0.0% | ||||
| Market Share - Americas - Class 4 & 5 | (1) | 10.8% | — | — | 103.8% | 11.2% | ||||
| Market Share - EMEA - Class 1 & 2 | (1) | 4.8% | — | — | 12.5% | 0.6% | ||||
| Market Share - EMEA - Class 3 | (1) | 2.4% | — | — | 0.0% | 0.0% | ||||
| Market Share - EMEA - Class 4 & 5 | (1) | 4.8% | — | — | 102.5% | 4.9% | ||||
| Market Share - Asia | 5% | — | — | 0.0% | 0.0% | |||||
| Market Share - Pacific | 4% | — | — | 50.5% | 2.0% | |||||
| Market Share - China | 1% | — | — | 105.7% | 1.1% | |||||
| Market Share - Japan | 1% | — | — | 50.0% | 0.5% | |||||
| Payout Percentage - Corporate (2) | 56.9% | |||||||||
| Final Payout Percentage with Operating Profit Percent Over-Ride (2) | 48.4% | |||||||||
| (1) | In 2016, market share for |
| (2) | Based on the |
| Performance Criteria | (A) Weighting | Performance Target | Performance Result | (B) Achievement Percentage | (A) x (B) Payout Percentage | ||||||
| Adjusted Operating Profit Percent - Global | 40% | — | — | 82.0% | 32.8% | ||||||
| Adjusted ROTCE - Global | 30% | — | — | 200.0% | 60.0% | ||||||
| Market Share - Americas w/o Brazil | 12% | — | — | 37.5% | 4.5% | ||||||
| Market Share - Brazil | 3% | — | — | 102.2% | 3.1% | ||||||
| Market Share - EMEA | 9% | — | — | 85.7% | 7.7% | ||||||
| Market Share - Asia | 2% | — | — | 50.0% | 1.0% | ||||||
| Market Share - Pacific | 3% | — | — | 130.0% | 3.9% | ||||||
| Market Share - Japan | 1% | — | — | 25.0% | 0.3% | ||||||
| Final Payout Percentage - Corporate | 113.3 | % | |||||||||
| (A) Weighting | Performance Target | Performance Result | (B) Achievement Percentage | (A) x (B) Payout Percentage | ||||||
| Adjusted Operating Profit Percent - Global | 50% | — | — | 63.8% | 31.9% | |||||
| Market Share - Americas - Class 1 & 2 | (1) | 20% | — | — | 43.2% | 8.6% | ||||
| Market Share - Americas - Class 3 | (1) | 10% | — | — | 0.0% | 0.0% | ||||
| Market Share - Americas - Class 4 & 5 | (1) | 20% | — | — | 103.8% | 20.8% | ||||
| Payout Percentage - Americas (2) | 61.3% | |||||||||
| Final Payout Percentage with Operating Profit Percent Over-Ride (2) | 52.1% | |||||||||
| (1) | In 2016, market share for the Americas and EMEA regions was separated by truck class (Class 1 & 2, Class 3 and Class 4 & 5) in order to maintain participant motivation and heighten efforts to drive business towards a richer revenue/margin mix. |
| (2) | Based on the application of the performance criteria in the above-table, the initial payout percentage under the Equity Long-Term Plan for Mr. Pascarelli was 61.3%. Because the Company failed to achieve at least 4% adjusted operating profit percent for 2016, the initial payout percentage for Mr. Pascarelli was reduced to 85% of the initial payout percentage in accordance with the Equity Long-Term Plan's operating profit percent over-ride feature. |
| • | the amounts credited under the Excess Plans each year are paid |
| • |
| Named Executive Officer | 2016 Short-Term Plan Target % | 2017 Short-Term Plan Target % | 2016 Long-Term Plan Target % (1) | 2017 Long-Term Plan Target % (1) | ||||
| Alfred M. Rankin, Jr. | 100% | 105% | 285% | 290% | ||||
| Colin Wilson | 80% | 80% | 150% | 170% | ||||
| Charles F. Pascarelli | 55% | 60% | 90% | 90% | ||||
| Rajiv K. Prasad | 55% | 60% | 90% | 90% | ||||
| (1) | The Long-Term Plan target percentages in the above-table do not include the 15% increase to reflect the immediately taxable nature of the equity awards. |
| Compensation Committee Report | ||||
| Summary Compensation Table | ||||
| Name and Principal Position | Year | Salary(2)($) | Stock Awards(3)($) | Non-Equity Incentive Plan Compensation ($) | Change in Pension Value (4) and Nonqualified Deferred Compensation Earnings(5) ($) | All Other Compensation(6) ($) | Total ($) | ||||
| Alfred M. Rankin, Jr.; Chairman, President and CEO of Hyster-Yale; Chairman of NMHG (1) | 2013 | $776,400 | $4,198,497 | $1,621,783 | (7) | $53,106 | $402,629 | $7,052,415 | |||
| 2012 | $1,126,809 | $3,790,982 | $1,939,985 | (8) | $80,096 | $536,917 | $7,474,789 | ||||
| 2011 | $1,217,000 | $1,426,409 | $1,589,048 | (8) | $1,871,523 | $629,760 | $6,733,740 | ||||
| Kenneth C. Schilling, Vice President and Chief Financial Officer of Hyster-Yale and NMHG (9) | 2013 | $346,786 | $531,507 | $301,192 | (7) | $8,072 | $81,442 | $1,268,999 | |||
| 2012 | $318,687 | $223,909 | $192,410 | (8) | $8,214 | $78,184 | $821,404 | ||||
| 2011 | $297,022 | $81,785 | $156,613 | (8) | $8,361 | $76,218 | $619,999 | ||||
| Michael P. Brogan; Vice-Chairman and CEO of NMHG | 2013 | $646,252 | $2,177,590 | $1,024,531 | (7) | $450,770 | $243,363 | $4,542,506 | |||
| 2012 | $606,590 | $0 | $1,224,582 | (10) | $499,335 | $243,915 | $2,574,422 | ||||
| 2011 | $574,711 | $0 | $1,184,765 | (10) | $184,658 | $209,774 | $2,153,908 | ||||
| Colin Wilson; President, Chief Operating Officer and President, Americas of NMHG | 2013 | $531,369 | $1,148,517 | $576,276 | (7) | $257,435 | $157,362 | $2,670,959 | |||
| 2012 | $501,063 | $0 | $674,731 | (10) | $261,481 | $155,997 | $1,593,272 | ||||
| 2011 | $478,727 | $0 | $653,075 | (10) | $143,030 | $136,302 | $1,411,134 | ||||
| Rajiv K. Prasad; Vice President, Product Development & Manufacturing of NMHG (11) | 2013 | $374,916 | $564,493 | $319,930 | (7) | $54,766 | $82,581 | $1,396,686 | |||
| Name and Principal Position | Year | Salary(1)($) | Stock Awards(2)($) | Non-Equity Incentive Plan Compensation ($) | Change in Pension Value (3) and Nonqualified Deferred Compensation Earnings(4) ($) | All Other Compensation(5) ($) | Total ($) | |||||||
| Alfred M. Rankin, Jr.; Chairman, President and CEO - Hyster-Yale; Chairman - HYG | 2016 | $873,290 | $806,830 | $830,146 | (6) | $32,156 | $266,410 | $2,808,832 | ||||||
| 2015 | $844,900 | $665,124 | $958,893 | (6) | $36,577 | $301,837 | $2,807,331 | |||||||
| 2014 | $813,720 | $1,109,209 | $1,171,982 | (6) | $39,811 | $328,978 | $3,463,700 | |||||||
| Kenneth C. Schilling, Senior Vice President and Chief Financial Officer - Hyster-Yale and HYG | 2016 | $394,693 | $100,831 | $160,692 | (6) | $8,473 | $76,705 | $741,394 | ||||||
| 2015 | $380,282 | $83,334 | $189,663 | (6) | $9,539 | $87,525 | $750,343 | |||||||
| 2014 | $363,126 | $135,804 | $219,014 | (6) | $10,469 | $91,476 | $819,889 | |||||||
| Colin Wilson; President and CEO, HYG - Hyster-Yale; President and CEO - HYG | 2016 | $670,000 | $415,509 | $536,130 | (6) | $64,385 | $179,992 | $1,866,016 | ||||||
| 2015 | $640,000 | $343,372 | $634,951 | (6) | $81,708 | $198,439 | $1,898,470 | |||||||
| 2014 | $596,665 | $393,203 | $541,632 | (6) | $111,455 | $183,755 | $1,826,710 | |||||||
| Charles F. Pascarelli; Senior Vice President, President, Americas - HYG | 2016 | $452,631 | $163,705 | $236,369 | (6) | $10,865 | $94,429 | $957,999 | ||||||
| 2015 | $440,030 | $112,269 | $261,262 | (6) | $11,488 | $103,668 | $928,717 | |||||||
| 2014 | $393,360 | $159,358 | $258,712 | (6) | $9,336 | $124,335 | $945,101 | |||||||
| Rajiv K. Prasad; Senior Vice President, Product Development, Manufacturing and Supply Chain Strategy - HYG | 2016 | $463,337 | $152,069 | $196,105 | (6) | $10,375 | $83,929 | $905,815 | ||||||
| 2015 | $442,226 | $125,722 | $245,058 | (6) | $13,148 | $90,863 | $917,017 | |||||||
| 2014 | $405,084 | $164,419 | $254,886 | (6) | $26,259 | $90,451 | $941,099 | |||||||
| (1) | The amounts reported |
| (2) | The amounts |
| Amounts listed in this column include the aggregate change in the actuarial present value of accumulated plan benefits under our frozen defined benefit pension plans, as described in more detail in the Pension Benefits Table on page |
Amounts listed in this column also include interest that is in excess of 120% of the federal long-term interest rate, compounded monthly, that was credited to the |
| All other compensation earned during |
Alfred M. Rankin, Jr. | Kenneth C. Schilling | Michael P. Brogan | Colin Wilson | Rajiv K. Prasad | Alfred M. Rankin, Jr. | Kenneth C. Schilling | Colin Wilson | Charles F. Pascarelli | Rajiv K. Prasad | ||||||||
| Employer Tax-Favored Matching Contributions | $0 | $7,563 | $7,563 | $7,563 | $0 | $7,813 | $7,813 | $7,813 | $7,813 | ||||||||
| Employer Excess Plan Matching Contributions | $49,298 | $6,715 | $25,247 | $16,324 | $0 | $41,828 | $8,070 | $24,553 | $11,386 | $10,955 | |||||||
| Employer Tax-Favored Profit Sharing Contributions | $0 | $25,938 | $10,013 | $15,240 | $0 | $26,249 | $27,188 | $26,249 | $22,857 | ||||||||
| Employer Excess Plan Profit Sharing Contributions | $313,627 | $38,920 | $180,627 | $119,024 | $58,458 | $185,483 | $32,128 | $114,988 | $45,555 | $39,195 | |||||||
| Other Excess Plan Employer Retirement Contributions | $37,710 | $0 | $0 | $0 | $37,710 | $0 | $0 | $0 | $0 | ||||||||
| Employer Paid Life Insurance Premiums | $1,994 | $1,260 | $2,942 | $2,118 | $1,320 | $1,389 | $1,208 | $2,217 | $1,405 | $1,414 | |||||||
| Other | $0 | $1,046 | $2,320 | $0 | $0 | $1,237 | $3,233 | $2,021 | $1,695 | ||||||||
| Total | $402,629 | $81,442 | $243,363 | $157,362 | $82,581 | $266,410 | $76,705 | $179,992 | $94,429 | $83,929 | |||||||
| The amounts listed |
(A) Estimated Future or Possible Payouts Under Non-Equity Incentive Plan Awards | (B) Estimated Future or Possible Payouts Under Equity Incentive Plan Awards | Grant Date Fair Value of Stock Awards (2) ($) | (A) Estimated Future or Possible Payouts Under Non-Equity Incentive Plan Awards | (B) Estimated Future or Possible Payouts Under Equity Incentive Plan Awards | Grant Date Fair Value of Stock Awards (2) ($) | |||||||||||||||||||||||
| Name | Grant Date | Plan Name (1) | Target ($) | Maximum ($) | Target ($) | Maximum ($) | Grant Date | Plan Name (1) | Target ($) | Maximum ($) | Target ($) | Maximum ($) | ||||||||||||||||
| Alfred M. Rankin, Jr. | N/A | Short-Term Plan | (3) | $620,340 | $930,510 | N/A | N/A | N/A | N/A | Short-Term Plan | (3) | $764,925 | $1,147,388 | N/A | N/A | N/A | ||||||||||||
| 2/12/2014 | Equity Long-Term Plan | (4) | $798,998 | $1,597,996 | $1,483,853 | $2,967,706 | $4,198,497 | 2/27/2017 | Equity Long-Term Plan | (4) | $877,465 | $1,754,929 | $1,629,577 | $3,259,155 | $806,830 | |||||||||||||
| Kenneth C. Schilling | N/A | Short-Term Plan | (3) | $161,550 | $242,325 | N/A | N/A | N/A | N/A | Short-Term Plan | (3) | $194,600 | $291,900 | N/A | N/A | N/A | ||||||||||||
| 2/12/2014 | Equity Long-Term Plan | (4) | $101,148 | $202,297 | $187,847 | $375,694 | $531,507 | 2/27/2017 | Equity Long-Term Plan | (4) | $109,657 | $219,314 | $203,649 | $407,298 | $100,831 | |||||||||||||
| Michael P. Brogan | N/A | Short-Term Plan | (3) | $480,480 | $720,720 | N/A | N/A | N/A | ||||||||||||||||||||
| Colin Wilson | N/A | Short-Term Plan | (3) | $598,800 | $898,200 | N/A | N/A | N/A | ||||||||||||||||||||
| 2/12/2014 | Equity Long-Term Plan | (4) | $414,414 | $828,828 | $769,626 | $1,539,252 | $2,177,590 | 2/27/2017 | Equity Long-Term Plan | (4) | $451,907 | $903,814 | $839,256 | $1,678,512 | $415,509 | |||||||||||||
| Colin Wilson | N/A | Short-Term Plan | (3) | $284,460 | $426,690 | N/A | N/A | N/A | ||||||||||||||||||||
| Charles F. Pascarelli | N/A | Short-Term Plan | (3) | $251,130 | $376,695 | N/A | N/A | N/A | ||||||||||||||||||||
| 2/12/2014 | Equity Long-Term Plan | (4) | $218,582 | $437,163 | $405,937 | $811,875 | $1,148,517 | 2/27/2017 | Equity Long-Term Plan | (4) | $165,403 | $330,807 | $307,178 | $614,355 | $163,705 | |||||||||||||
| Rajiv K. Prasad | N/A | Short-Term Plan | (3) | $171,585 | $257,378 | N/A | N/A | N/A | N/A | Short-Term Plan | (3) | $251,130 | $376,695 | N/A | N/A | N/A | ||||||||||||
| 2/12/2014 | Equity Long-Term Plan | (4) | $107,431 | $214,863 | $199,516 | $399,031 | $564,493 | 2/27/2017 | Equity Long-Term Plan | (4) | $165,403 | $330,807 | $307,178 | $614,355 | $152,069 | |||||||||||||
| (1) | There are no minimum or threshold payouts to the NEOs under any of our Incentive Plans. |
| (2) | Amounts in this column reflect the grant date fair value of shares of stock that were granted and initially issued under the Equity Long-Term Plan. The amount shown is the grant date fair market value as determined in accordance with FASB ASC Topic 718. These amounts are also reflected in the Summary Compensation Table on page |
| (3) | Awards under the Short-Term Plan are based on a one-year performance period that consists solely of the |
| (4) | These amounts reflect the awards issued under the Equity Long-Term Plan for |
| Equity Compensation | ||||
| Name | Number of Shares Acquired on Vesting (#) (1) | Value Realized on Vesting ($) (1) | Number of Shares Acquired on Vesting (#) | Value Realized on Vesting ($) | ||||
| Alfred M. Rankin, Jr. | 33,146 | $2,877,239 | 13,243 | $806,830 | ||||
| Kenneth C. Schilling | 5,029 | $436,542 | 1,655 | $100,831 | ||||
| Michael P. Brogan | 16,612 | $1,442,005 | ||||||
| Colin Wilson | 10,052 | $872,564 | 6,820 | $415,509 | ||||
| Charles F. Pascarelli | 2,687 | $163,705 | ||||||
| Rajiv K. Prasad | 4,989 | $433,070 | 2,396 | (1) | $145,976 | |||
| (1) |
| Name | Number of Shares Issued Before Net Exercise | Fair Market Value Realized On All Shares Initially Issued | ||
| Alfred M. Rankin, Jr. | 48,367 | $4,198,497 | ||
| Kenneth C. Schilling | 6,123 | $531,507 | ||
| Michael P. Brogan | 25,086 | $2,177,590 | ||
| Colin Wilson | 13,231 | $1,148,517 | ||
| Rajiv K. Prasad | 6,503 | $564,493 | ||
| Name | Number of Shares Issued Before Net Exercise | Fair Market Value Realized On All Shares Initially Issued | ||
| Rajiv K. Prasad | 2,496 | $152,069 | ||
| Potential Payments Upon Termination/Change in Control | ||||
| Name | Estimated Total Value of Payments Based on Incentive Plan Award Targets ($)(1) | Estimated Total Value of Payments Based on Accrued Balance in Cash Long-Term Plan ($)(2) | Estimated Total Value of Cash Payments Based on Accrued Balance in Excess Plans and Frozen Unfunded Plan ($)(3) | Estimated Total Value of all Payments ($) | Estimated Total Value of Payments Based on Incentive Plan Award Targets ($)(1) | Estimated Total Value of Cash Payments Based on Accrued Balance in Excess Plans and Frozen Unfunded Plan ($)(2) | Estimated Total Value of all Payments ($) | |||||||
| Alfred M. Rankin, Jr. | $2,903,191 | N/A | $532,616 | $3,435,807 | $3,271,967 | $305,524 | $3,577,491 | |||||||
| Kenneth C. Schilling | $450,545 | N/A | $86,116 | $536,661 | $507,906 | $85,378 | $593,284 | |||||||
| Michael P. Brogan | $1,664,520 | $2,779,752 | $1,449,840 | $5,894,112 | ||||||||||
| Colin Wilson | $908,979 | $1,466,022 | $1,666,440 | $4,041,441 | $1,889,963 | $1,616,551 | $3,506,514 | |||||||
| Rajiv K. Prasad | $478,532 | $517,672 | $67,227 | $1,063,431 | ||||||||||
| Name | Estimated Total Value of Payments Based on Incentive Plan Award Targets ($)(1) | Estimated Total Value of Cash Payments Based on Accrued Balance in Excess Plans and Frozen Unfunded Plan ($)(2) | Estimated Total Value of all Payments ($) | |||
| Charles F. Pascarelli | $723,711 | $96,790 | $820,501 | |||
| Rajiv K. Prasad | $723,711 | $91,590 | $815,301 | |||
| (1) | This column reflects the award targets for the NEOs under the Incentive Plans for |
| This column reflects the account balances of the NEOs as of December 31, |
| Nonqualified Deferred Compensation Benefits | ||||
| Name | Plan Name | Executive Contributions in 2013 ($)(1) | Employer Contributions in 2013 ($)(2) | Aggregate Earnings in 2013 ($)(2) | Aggregate Withdrawals/ Distributions in 2013 ($) | Aggregate Balance at December 31, 2013 ($) | Plan Name | Executive Contributions in 2016 ($)(1) | Employer Contributions in 2016 ($)(2) | Aggregate Earnings in 2016 ($)(2) | Aggregate Withdrawals/ Distributions in 2016 ($) | Aggregate Balance at December 31, 2016 ($) | ||||||||||||
| Alfred M. Rankin, Jr. | Executive Excess Plan | $60,680 | $400,635 | $71,301 | $714,694(3) | $532,616(4) | Executive Excess Plan | $0 | $265,021 | $40,503 | $345,564(3) | $305,524(4) | ||||||||||||
| Kenneth C. Schilling | Excess Plan | $30,091 | $45,635 | $10,390 | $79,490(3) | $86,116(4) | Excess Plan | $34,943 | $40,198 | $10,237 | $95,147(3) | $85,378(4) | ||||||||||||
| Michael P. Brogan | Excess Plan | $59,057 | $205,874 | $40,960 | $304,032(3) | $305,891(4) | ||||||||||||||||||
| Frozen Unfunded Plan | $0(5) | $0(5) | $117,218 | $117,218(6) | $1,143,949(7) | |||||||||||||||||||
| Cash Long-Term Plan | $0(5) | $0(5) | $361,193 | $0 | $2,779,752(8) | |||||||||||||||||||
| Colin Wilson | Excess Plan | $62,123 | $135,348 | $27,845 | $221,792(3) | $225,316(4) | Excess Plan | $89,883 | $139,541 | $32,213 | $253,255(3) | $261,637(4) | ||||||||||||
| Frozen Unfunded Plan | $0(5) | $0(5) | $126,497 | $126,497(6) | $1,441,124(7) | Frozen Unfunded Plan | $0(5) | $0(5) | $40,287 | $41,846(6) | $1,354,914(7) | |||||||||||||
| Cash Long-Term Plan | $0(5) | $0(5) | $190,490 | $0 | $1,466,022(8) | Cash Long-Term Plan | $0(5) | $0(5) | $0 | $525,724 (8) | $0 | |||||||||||||
| Charles F. Pascarelli | Excess Plan | $26,796 | $56,941 | $13,053 | $102,797(3) | $96,790(4) | ||||||||||||||||||
| Rajiv K. Prasad | Excess Plan | $0 | $58,458 | $8,769 | $77,531(3) | $67,227(4) | Excess Plan | $29,036 | $50,150 | $12,404 | $99,732(3) | $91,590(4) | ||||||||||||
| Cash Long-Term Plan | $0(5) | $0(5) | $67,265 | $0 | $517,672(8) | Cash Long-Term Plan | $0(5) | $0(5) | $0 | $258,717(8) | $0 | |||||||||||||
| (1) | These amounts, which were otherwise payable in |
| (2) | All employer contributions and the above-market earnings portion of the amounts shown in the "Aggregate Earnings" column are included in the Summary Compensation Table. |
| (3) | The NEOs each receive payment of the amounts earned under the Excess Plans for each calendar year (including interest) no later than March 15th of the following year. Because the payments for |
| (4) | $ |
| (5) | No additional contributions (other than interest credits) |
| (6) | The interest that is accrued under the Frozen Unfunded Plan each calendar year is paid no later than March 15th of the following year. Because the interest that was credited to |
| (7) | $ |
| (8) | Messrs. Company. |
| Defined Benefit Pension Plans | ||||
| Name | Plan Name | Number of Years Credited Service (#) | Present Value of Accumulated Benefit ($) | Payments During Last Fiscal Year ($) | Plan Name | Number of Years Credited Service (#) | Present Value of Accumulated Benefit ($) | Payments During Last Fiscal Year ($) | ||||||||
| Alfred M. Rankin, Jr. | N/A (1) | N/A | N/A | N/A | N/A (1) | N/A | N/A | N/A | ||||||||
| Kenneth C. Schilling | N/A (1) | N/A | N/A | N/A | N/A (1) | N/A | N/A | N/A | ||||||||
| Michael P. Brogan | The UK Plan | 15.10 | $1,246,746 | N/A | ||||||||||||
| The UK Excess Plan | 18.25 | (2) | $109,304 | $0 | ||||||||||||
| Colin Wilson | The UK Plan | 6.60 | (3) | $362,064 | $0 | The UK Plan | 6.60 | (2) | $471,857 | $0 | ||||||
| Charles F. Pascarelli | N/A (1) | N/A | N/A | N/A | ||||||||||||
| Rajiv K. Prasad | N/A (1) | N/A | N/A | N/A | N/A (1) | N/A | N/A | N/A | ||||||||
| (1) | Messrs. A. Rankin, Schilling, Prasad and |
| (2) |
| For Mr. Wilson, the number of years of credited service taken into account to determine pension benefits under the UK Plan was frozen as of May 31, 1995. |
| Class A Common Stock | Class A Common Stock | |||||||||||||||||||||||||||
| Name | Title of Class | Sole Voting and Investment Power | Shared Voting or Investment Power | Aggregate Amount | Percent of Class(1) | Title of Class | Sole Voting and Investment Power | Shared Voting or Investment Power | Aggregate Amount | Percent of Class(1) | ||||||||||||||||||
Dimensional Fund Advisors LP (2) Palisades West, Building One 6300 Bee Cave Road Austin, TX 78746 | Class A | 866,630 | (2) | — | 866,630 | (2) | 6.76 | % | ||||||||||||||||||||
Dimensional Fund Advisors LP (2) Building One 6300 Bee Cave Road Austin, TX 78746 | Class A | 871,382 | (2) | — | 871,382 | (2) | 6.95 | % | ||||||||||||||||||||
LSV Asset Management (3) 155 N. Wacker Drive, Suite 4600 Chicago, IL 60606 | Class A | 865,518 | (3) | — | 865,518 | (3) | 6.76 | % | Class A | 768,858 | (3) | — | 768,858 | (3) | 6.14 | % | ||||||||||||
Beatrice B. Taplin Suite 300 5875 Landerbrook Drive Cleveland, OH 44124-4069 | Class A | 679,663 | — | 679,663 | 5.30 | % | ||||||||||||||||||||||
| Black Rock Inc. (4) 40 East 52nd Street New York, NY 10022 | Class A | 675,213 | (4) | — | 675,213 | (4) | 5.27 | % | ||||||||||||||||||||
| John C. Butler, Jr. (5) | Class A | 29,382 | 1,123,082 | (6) | 1,152,464 | (6) | 8.99 | % | ||||||||||||||||||||
Blackrock, Inc. (4) 55 East 52nd Street New York, NY 10055 | Class A | 638,221 | (4) | — | (4) | 638,221 | (4) | 5.10 | % | |||||||||||||||||||
| J. C. Butler, Jr. (5) | Class A | 35,194 | 1,253,323 | (6) | 1,288,517 | (6) | 10.28 | % | ||||||||||||||||||||
| Carolyn Corvi (5) | Class A | 1,450 | — | 1,450 | — | Class A | 5,432 | — | 5,432 | — | ||||||||||||||||||
| John P. Jumper (5) | Class A | 1,776 | — | 1,776 | — | Class A | 5,758 | — | 5,758 | — | ||||||||||||||||||
| Dennis W. LaBarre (5) | Class A | 10,874 | — | 10,874 | — | Class A | 14,856 | — | 14,856 | 0.12 | % | |||||||||||||||||
| F. Joseph Loughrey (5) | Class A | 197 | — | 197 | — | Class A | 4,179 | — | 4,179 | — | ||||||||||||||||||
| H. Vincent Poor | Class A | — | — | — | — | |||||||||||||||||||||||
| Alfred M. Rankin, Jr. | Class A | 313,442 | 1,140,623 | (7) | 1,454,065 | (7) | 11.35 | % | Class A | 97,369 | 1,404,338 | (7) | 1,501,707 | (7) | 11.99 | % | ||||||||||||
| Claiborne R. Rankin (5) | Class A | 125,302 | 1,091,995 | (8) | 1,217,297 | (8) | 9.50 | % | Class A | 129,284 | 1,168,064 | (8) | 1,297,348 | (8) | 10.35 | % | ||||||||||||
| Michael E. Shannon (5) | Class A | 13,364 | — | 13,364 | 0.10 | % | ||||||||||||||||||||||
| John M. Stropki (5) | Class A | 197 | — | 197 | — | Class A | 7,216 | — | 7,216 | — | ||||||||||||||||||
| Britton T. Taplin (5) | Class A | 34,989 | 5,755 | (9) | 40,744 | (9) | 0.32 | % | Class A | 38,345 | 332,287 | (9) | 370,632 | (9) | 2.96 | % | ||||||||||||
| Eugene Wong (5) | Class A | 8,262 | — | 8,262 | — | Class A | 15,281 | — | 15,281 | 0.12 | % | |||||||||||||||||
| Colin Wilson | Class A | 29,364 | — | 29,364 | 0.23 | % | ||||||||||||||||||||||
| Kenneth C. Schilling | Class A | 20,678 | — | 20,678 | 0.16 | % | Class A | 30,184 | — | 30,184 | 0.24 | % | ||||||||||||||||
| Michael P. Brogan | Class A | 16,612 | — | 16,612 | 0.13 | % | ||||||||||||||||||||||
| Colin Wilson | Class A | 10,052 | — | 10,052 | — | |||||||||||||||||||||||
| Charles Pascarelli | Class A | 10,823 | — | 10,823 | — | |||||||||||||||||||||||
| Rajiv K. Prasad | Class A | 4,989 | — | 4,989 | — | Class A | 12,219 | — | 12,219 | — | ||||||||||||||||||
| All executive officers and directors as a group (25 persons) | Class A | 672,365 | 1,208,531 | (10) | 1,880,896 | (10) | 14.68 | % | ||||||||||||||||||||
| All executive officers and directors as a group (26 persons) | Class A | 493,370 | 1,820,004 | (10) | 2,313,374 | (10) | 18.46 | % | ||||||||||||||||||||
| (1) | Less than 0.10%, except as otherwise indicated. |
| (2) | A Schedule 13G/A, which was filed with the SEC with respect to Class A Common on February |
| (3) | A Schedule 13G filed with the SEC with respect to Class A Common on February |
| (4) | A Schedule 13G filed with the SEC with respect to Class A Common on January 30, 2017 reported that Blackrock, Inc. is the beneficial owner of 638,221 shares of Class A Common, has sole voting power over 608,340 shares of Class A Common and has sole dispositive power over 638,221 shares of Class A Common and may be deemed to beneficially own the shares of Class A Common reported above as a result of being an investment adviser. |
| (5) | Pursuant to our Non-Employee Directors' Plan, each non-employee director has the right to acquire additional shares of Class A Common within 60 days after |
| (6) | J.C. Butler, Jr. may be deemed to be a member of the group, described in Note (7) below, as |
| (7) | Alfred M. Rankin, Jr. may be deemed to be a member of Rankin Associates II, L.P. ("Rankin II"), |
| (8) | Claiborne R. Rankin may be deemed to be a member of the group described in note (7) above as a result of holding through his trust, of which he is trustee, partnership interests in Rankin I. Mr. Rankin may be deemed to be a member of the group described in Note (7) above, as |
| (9) | Britton T. Taplin may be deemed to be a member of a group, as a result of holding interest in Abigail LLC ("Abigail"). Mr. Taplin, therefore, may be deemed to beneficially own and share the power to vote 326,532 shares of Class A Common held by Abigail. Mr. Taplin disclaims beneficial ownership of such shares to the extent in excess of his pecuniary interest in such entity. Mr. Taplin also is deemed to share with his spouse voting and investment power over 5,755 shares of Class A Common held by Mr. Taplin's spouse; however, Mr. Taplin disclaims beneficial ownership of such shares. |
| (10) | The aggregate amount of Class A Common beneficially owned by all executive officers and directors and the aggregate amount of Class A Common beneficially owned by all executive officers and directors as a group for which they have shared voting or investment power include the shares of Class A Common of which Mr. Butler has disclaimed beneficial ownership in note (6) above. Mr. A. Rankin has disclaimed beneficial ownership in note (7) above, Mr. C. Rankin has disclaimed beneficial ownership in note (8) above and Mr. B. Taplin has disclaimed beneficial ownership in note (9) above. As described in note (5) above, the aggregate amount of Class A Common beneficially owned by all executive officers and directors as a group as set forth in the table above does not include shares that the non-employee directors have the right to acquire within 60 days after |
| Class B Common Stock | Class B Common Stock | |||||||||||||||||||||||||||||
| Name | Title of Class | Sole Voting and Investment Power | Shared Voting or Investment Power | Aggregate Amount | Percent of Class(1) | Title of Class | Sole Voting and Investment Power | Shared Voting or Investment Power | Aggregate Amount | Percent of Class(1) | ||||||||||||||||||||
Clara Taplin Rankin, et al. (2) c/o PNC Bank, N.A. 3550 Lander Road Pepper Pike, OH 44124 | Class B | — | (2 | ) | — | (2) | 3,302,756 | (2 | ) | 82.32 | % | Class B | — | (2) | — | (2) | 3,302,756 | (2) | 84.25 | % | ||||||||||
Beatrice B. Taplin Suite 300 5875 Landerbrook Drive Cleveland, OH 44124-4069 | Class B | 680,523 | (3 | ) | — | 680,523 | (3 | ) | 16.96 | % | Class B | 672,693 | (3) | — | 672,693 | (3) | 17.16 | % | ||||||||||||
Rankin Associates I, L.P., et al. (4) Suite 300 5875 Landerbrook Drive Cleveland, OH 44124-4069 | Class B | — | (4 | ) | — | (4) | 605,986 | (4 | ) | 15.10 | % | Class B | — | (4) | — | (4) | 605,986 | (4) | 15.46 | % | ||||||||||
Rankin Associates IV, L.P., et al. (5) Suite 300 5875 Landerbrook Drive Cleveland, OH 44124-4069 | Class B | — | (5 | ) | — | (5) | 400,000 | (5 | ) | 9.97 | % | Class B | — | (5) | — | (5) | 490,440 | (5) | 12.51 | % | ||||||||||
| Rankin Associates II, L.P. et. al. (6) Suite 300 5875 Landerbrook Drive Cleveland, OH 44124-4069 | Class B | — | (6 | ) | — | (6) | 338,295 | (6 | ) | 8.43 | % | Class B | — | (6) | — | (6) | 338,295 | (6) | 8.63 | % | ||||||||||
| FMR LLC (7) 245 Summer Street Boston, MA 02210 | Class B | 310,000 | (7) | — | (7) | 310,000 | (7) | 7.91 | % | |||||||||||||||||||||
| AMR Associates, L.P. et al. (8) 5875 Landerbrook Drive, Suite 300 Cleveland, OH 44124-4069 | Class B | — | (8) | 217,394 | (8) | 217,394 | (8) | 5.55 | % | |||||||||||||||||||||
| J.C. Butler, Jr. | Class B | 27,272 | (7 | ) | 1,389,922 | (7) | 1,417,194 | (7 | ) | 35.32 | % | Class B | 27,272 | (9) | 1,710,701 | (9) | 1,737,973 | (9) | 44.33 | % | ||||||||||
| Carolyn Corvi | Class B | — | — | — | — | Class B | — | — | — | — | ||||||||||||||||||||
| John P. Jumper | Class B | 326 | — | 326 | — | Class B | 326 | — | 326 | — | ||||||||||||||||||||
| Dennis W. LaBarre | Class B | 9,424 | — | 9,424 | 0.23 | % | Class B | 9,424 | — | 9,424 | 0.24 | % | ||||||||||||||||||
| F. Joseph Loughrey | Class B | — | — | — | — | Class B | — | — | — | — | ||||||||||||||||||||
| H. Vincent Poor | Class B | — | — | — | — | |||||||||||||||||||||||||
| Alfred M. Rankin, Jr. | Class B | 273,043 | (8 | ) | 1,408,581 | (8) | 1,681,624 | (8 | ) | 41.91 | % | Class B | 29,759 | (10) | 1,704,754 | (10) | 1,734,513 | (10) | 44.24 | % | ||||||||||
| Claiborne Rankin | Class B | 123,760 | (9 | ) | 1,362,363 | (9) | 1,486,123 | (9 | ) | 37.04 | % | |||||||||||||||||||
| Michael E. Shannon | Class B | — | — | — | — | |||||||||||||||||||||||||
| Claiborne R. Rankin | Class B | 123,760 | (11) | 1,437,504 | (11) | 1,561,264 | (11) | 39.82 | % | |||||||||||||||||||||
| John M. Stropki | Class B | — | — | — | — | Class B | — | — | — | — | ||||||||||||||||||||
| Britton T. Taplin | Class B | 33,539 | 5,755 | (10) | 39,294 | (10 | ) | 0.98 | % | Class B | 35,497 | 5,755 | (12) | 41,252 | (12) | 1.05 | % | |||||||||||||
| Eugene Wong | Class B | 5,812 | — | 5,812 | 0.14 | % | Class B | 5,812 | — | 5,812 | 0.15 | % | ||||||||||||||||||
| Kenneth C. Schilling | Class B | 11,221 | — | 11,221 | 0.28 | % | Class B | 7,024 | — | 7,024 | 0.18 | % | ||||||||||||||||||
| Michael P. Brogan | Class B | — | — | — | — | |||||||||||||||||||||||||
| Colin Wilson | Class B | — | — | — | — | Class B | — | — | — | — | ||||||||||||||||||||
| Charles Pascarelli | Class B | — | — | — | — | |||||||||||||||||||||||||
| Rajiv K. Prasad | Class B | — | — | — | — | Class B | — | — | — | — | ||||||||||||||||||||
| All executive officers and directors as a group (25 persons) | Class B | 496,885 | (11 | ) | 1,478,059 | (11) | 1,974,944 | (11 | ) | 49.22 | % | |||||||||||||||||||
| All executive officers and directors as a group (26 persons) | Class B | 248,334 | (13) | 1,771,878 | (13) | 2,020,212 | (13) | 51.53 | % | |||||||||||||||||||||
| (1) | Less than 0.10%, except as otherwise indicated. |
| (2) | A Schedule 13D, which was filed with the SEC with respect to Class B Common and most recently amended on February 14, |
| (3) | Beatrice B. Taplin has the sole power to vote and dispose of |
| (4) | A Schedule 13D, which was filed with the SEC with respect to Class B Common and most recently amended on February 14, |
| (5) | A Schedule 13D, which was filed with the SEC with respect to Class B Common and most recently amended on February 14, |
| (6) | A Schedule 13D, which was filed with the SEC with respect to Class B Common and most recently amended on February 14, |
| (7) | Abigail P. Johnson is a Director, the Vice Chairman, the Chief Executive Officer and the President of FMR LLC. Members of the Johnson family, including Abigail P. Johnson, are the predominant owners, directly or through trusts, of Series B voting common shares of FMR LLC, representing 49% of the voting power of FMR LLC. The Johnson family group and all other Series B shareholders have entered into a shareholders' voting agreement under which all Series B voting common shares will be voted in accordance with the majority vote of Series B voting common shares. |
| (8) | A Schedule 13D, which was filed with the SEC with respect to Class B Common on March 10, 2017, reported that AMR Associates and the trusts holding partnership interest in AMR Associates may be deemed to be a group and therefore may be deemed as a group to beneficially own 217,394 shares of Class B Common held by AMR Associates. Although AMR Associates holds the 217,394 shares of Class B Common, it does not have any power to vote or dispose of such shares of Class B Common. Clara R. Williams and Helen R. Butler, as trustees and primary beneficiaries of trusts acting as general partners, share the power to vote such shares of Class B Common. Each of the trusts holding general and limited partnership interests in AMR Associates share with each other the power to dispose of such shares. Under the terms of the Limited Partnership Agreement of AMR Associates, AMR Associates may not dispose of Class B Common or convert Class B Common into Class A Common without the consent of the holders of a majority of the general partnership interest and more than 75% of all partnership interests in AMR Associates. The Stockholders 13D reported that the Class B Common beneficially owned by AMR Associates and each of the trusts holding partnership interest in AMR Associates is also subject to the stockholders' agreement. |
| (9) | J.C. Butler, Jr. may be deemed to be a member of the group described in Note (6) above, as |
| Alfred M. Rankin, Jr. may be deemed to be a member of the group described in Notes (4), (5), (6) and |
| Claiborne R. Rankin may be deemed to be a member of the group described in Notes (4), (5) and (6) above, as |
| Britton T. Taplin is deemed to share with his spouse voting and investment power over 5,755 shares of Class B Common held by Mr. Taplin's spouse; however, Mr. Taplin disclaims beneficial ownership of such shares. |
| The aggregate amount of Class B Common beneficially owned by all executive officers and directors as a group and the aggregate amount of Class B Common beneficially owned by all executive officers and directors as a group for which they have shared voting or investment power include the shares of Class B Common of which Mr. Butler has disclaimed beneficial ownership in note |
| PROCEDURES FOR SUBMISSION AND CONSIDERATION OF DIRECTOR CANDIDATES | ||||
| 1. | The name and address of the stockholder recommending the candidate for consideration as such information appears on our records, the telephone number where such stockholder can be reached during normal business hours, the number of shares of Class A Common and Class B Common owned by such stockholder and the length of time such shares have been owned by the stockholder; if such person is not a stockholder of record or if such shares are owned by an entity, reasonable evidence of such person's beneficial ownership of such shares or such person's authority to act on behalf of such entity; |
| 2. | Complete information as to the identity and qualifications of the proposed nominee, including the full legal name, age, business and residence addresses and telephone numbers and other contact information, and the principal occupation and employment of the candidate recommended for consideration, including his or her occupation for at least the past five years, with a reasonably detailed description of the background, education, professional affiliations and business and other relevant experience (including directorships, employment and civic activities) and qualifications of the candidate; |
| 3. | The reasons why, in the opinion of the recommending stockholder, the proposed nominee is qualified and suited to be one of our directors; |
| 4. | The disclosure of any relationship the candidate being recommended has with us or any of our subsidiaries or affiliates, or our independent public accountants, whether direct or indirect; |
| 5. | The disclosure of any relationship of the candidate being recommended or any immediate family member of the candidate being recommended with our independent registered public accounting firm; |
| 6. | The disclosure of all relationships, arrangements and understandings between the proposing stockholder and the candidate and any other person(s) (naming such person(s)) pursuant to which the candidate is being proposed or would serve as a director, if elected; and |
| 7. | A written acknowledgment by the candidate being recommended that he or she has consented to being considered as a candidate, has consented to our undertaking of an investigation into that individual's background, education, experience and other qualifications and, in the event that the NCG Committee desires to do so, has consented to be named in our Proxy Statement and to serve as one of our directors, if elected. |
| SUBMISSION OF STOCKHOLDER PROPOSALS | ||||
| SOLICITATION OF PROXIES | ||||
| OTHER MATTERS | ||||